

- Cost of Floods
- Annual Occurrence
- Seasonal and Monthly Occurrence
- Causes of Flooding
- Flood Risk Mapping
- Flood Forecasting
Floods are the most frequent natural hazard in Canada (Government of Canada, 2014). Flooding is a natural environmental process, and is often caused by heavy rainfalls, sometimes in combination with rapid melting of snow on the ground. Other causes of floods include ice jams in rivers and high tides with storm surges along the coast. Flooding is essential for a healthy ecosystem; however with human encroachment on the flood plains of water bodies, flooding can lead to human hardship and economic loss.
Flood damage is an increasing problem in Newfoundland and Labrador because of increasing population density around water bodies and the higher values of water-front property. As per the 2012 “Flood Risk and Vulnerability Analysis Project” report, more than 267 communities in the province have been affected by flooding, causing over $262 million in damage over the past 64 years. An understanding of the history of flooding in the province is a critical piece of knowledge for both flood forecasting and flood risk assessments. Reducing exposure to flood risk is the only cost effective way to minimize future compensation expenses and re-building expenditures.
The Flood Events Inventory is a detailed history of provincial flood events including information such as the community affected, date it happened, and the reason for the flood event. The original Inventory is found in the report prepared for the Department by the AMEC Environment and Infrastructure Division entitled “Flood Risk and Vulnerability Analysis Project”. It contains 681 flood events and 296 storm events over the period of 1950 up to and including May 2014. A flood event is defined as the effect of a storm event on a single community, and is equal to one record in the inventory. A storm event, however, is an event that initiates at least one flood event. Therefore, a single storm event can be associated with multiple flood events, with an example being a Hurricane that affected many areas of the province. The Flood Events Inventory was subsequently updated to also include the period 1900 to 1949. The updated Flood Events Inventory is updated as and when new flood risk mapping studies are undertaken.
Below are some highlights of the findings from the “Flood Risk and Vulnerability Analysis Project” report.
Cost of Floods
Damage data is not provided for all flood events and, when it is available, it is not always accurate or all inclusive. Two sources of damage data are presently available in the Flood Event Inventory: damage estimates taken from published reports, and Disaster Financial Assistance Arrangements (DFAA) damage estimates (additional information about DFAA is available here). DFAA estimates are only available for the period 2000-2010, as they were compiled at the request of the Water Resources Management Division (WRMD) by Emergency Services Division -Newfoundland and Labrador for the most significant storm events of the last decade.
Below is a graph of DFAA flood damage estimates from 2000-2010. The figure suggests an increasing trend in flood damages in recent years; however, this is likely related more to the availability of flood damages data than to the damages themselves. One major event worth noting that is not included in this graph is Hurricane Leslie, which occurred in 2012 and damage estimate totals were approximately $10 million.
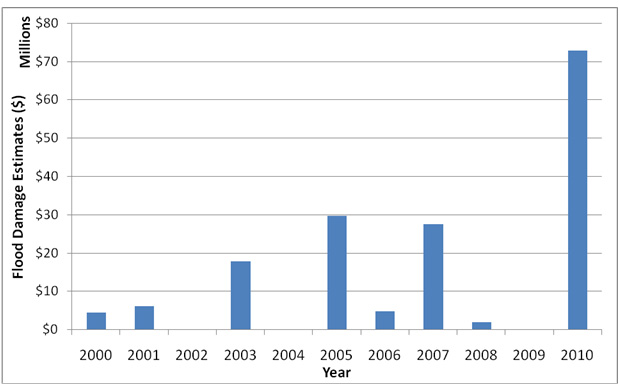
View graph data in tabular format
Below is a graph with a seasonal breakdown of DFAA Damage Estimates. Fall events result in the greatest dollar value flood damages as illustrated.
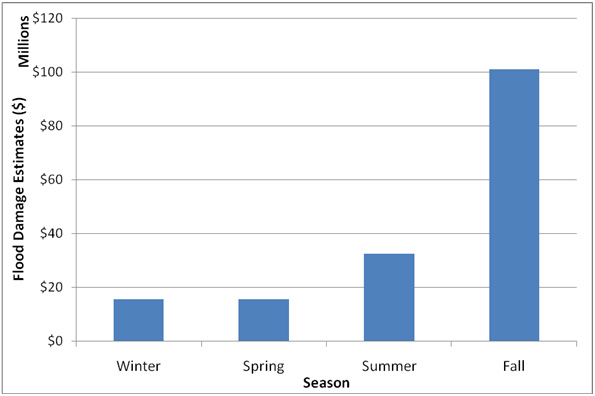
View graph data in tabular format
Annual Occurrence
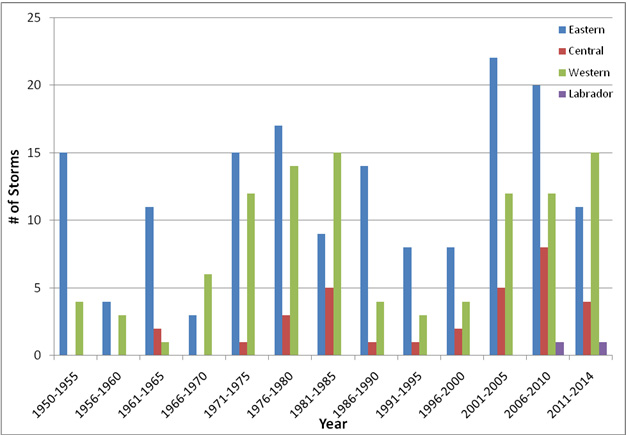
Over the entire inventory period, a total of 296 storm events are documented, averaging about 5 storms per year. However as previously stated, a single storm event can result in flooding that impacts numerous communities, such as Hurricane Igor which impacted 97 separate communities. Note that 2014 only shows an estimate up to and including the month of May.
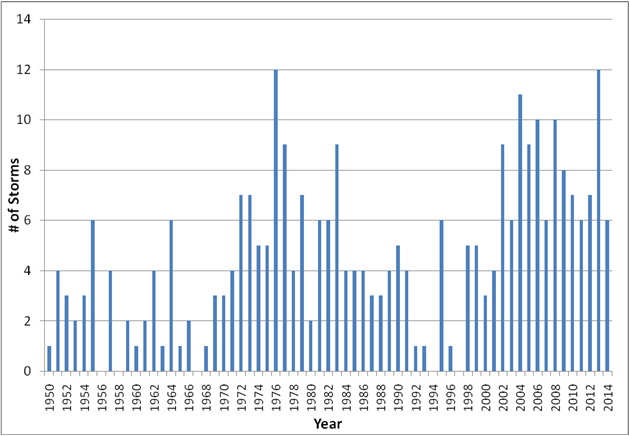
View graph data in tabular format
The next graph illustrates storm event occurrences in the different regions of the province. The Eastern region has a total of 157 storm events, and the Western region has 105. Central only has 32 documented storm events; much lower compared to Eastern and Western regions. Flooding in Labrador is rare with only 2 documented storm events in the current inventory.
View graph data in tabular format
Seasonal and Monthly Occurrence
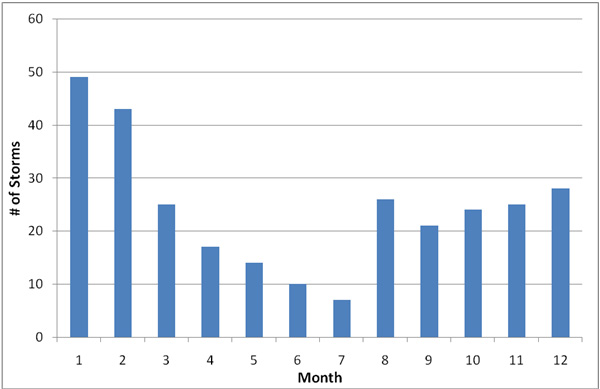
Over the entire inventory, January and February are the months where storm events are most common with about 32% of the storm events occurring in these months alone. The remainder of the months experience 10% or fewer occurrences. However, it is worth noting that storm events in September have caused the greatest impact in terms of locations experiencing flooding.
View graph data in tabular format
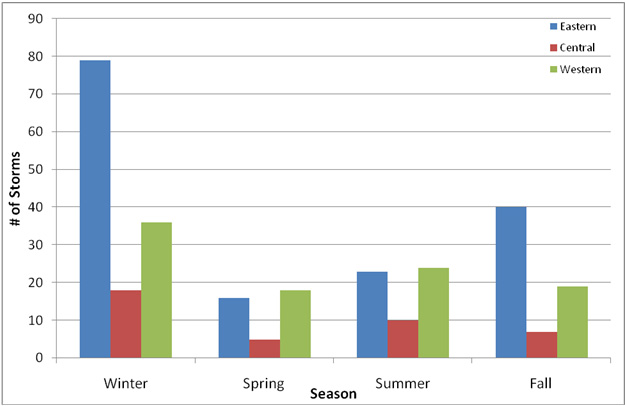
The graph below illustrates storm occurrence by season and region. Newfoundland and Labrador is most susceptible to storm events in the winter and fall, and least susceptible over the spring and summer months.
View graph data in tabular format
Causes of Flooding
The table below shows each type of storm event along with how often a flooding event was associated with it. It is clear that rainfall events result in the greatest number of flood events, representing 72% of the flood events in the inventory. The secondary causal event is related to coastal flooding, together with rainfall totaling to 89% of the events documented in the inventory. “N/A” represents flood events with an unknown type of storm event.
Event Type Occurrence
| Type of Event | % Occurrence of Flood Events by Type of Event |
|---|---|
| Rainfall | 72% |
| Coastal Flooding | 17% |
| Ice Jam | 5% |
| Snowmelt | 2% |
| Other | 1% |
| N/A | 3% |
Flooding is a natural event, but often has devastating effects on our lives and properties. These can be minimized by proper planning, state-of-the-art flood forecasting systems and appropriate flood control strategies. Analysis of the Flood Events Inventory provides us with data based on the flooding history of Newfoundland and Labrador, and can potentially aid in minimizing devastation that could result from a flooding event in the future.
Flood Risk Mapping
In Newfoundland, we try to discourage flood-vulnerable development on flood plains. The province, in cooperation with the federal government, undertakes hydrotechnical studies and mapping of flood risk areas.
Flood risk mapping in Newfoundland and Labrador delineates the floodway as zones where floods have a return period of 20 years (5% chance in any year) and the flood fringe where the risk of flooding is once in 100 years (1% chance in any year). These maps are used for public information, municipal planning, development control, and the setting of structural design criteria. All proposed developments in flood risk zones are evaluated against potential impacts on water resources, the structures themselves, and the surrounding areas.
To help support climate change adaptation, these flood risk mapping studies are being updated and new ones undertaken using climate change projections. This initiative is important for public safety and information, municipal and development planning, setting of structural design criteria, and flood response. This mapping will assist in regulating new developments in flood-prone areas, help minimize flood damage to properties and the environment, and restrict activities that could degrade water resources. A brochure is available outlining Government’s New Template for Climate Change Flood Risk Mapping.
The public information versions of the flood risk maps presented on these pages are suitable for general reference only. More detailed flood risk maps for use by municipal authorities, developers, planners, consultants and other government agencies are available on this webpage.
The maps in the table below are in JPG image and Adobe PDF format. The JPG images are viewable directly in your browser or an image viewing program. The Small JPG files are approximately 800×530 pixels and 80 Kb in size. The Large JPG files are about 1550×1024 pixels and 260 Kb in size. The PDF documents are in Adobe PDF format and, if you have an older browser, may require the free Adobe Acrobat Reader for viewing. The PDF documents offer the most detailed resolution and are about 1.1 Mb in size. If you right click on any of the links below and select the “Save as” option you can download that file to your computer for later viewing.
A page is available with scanned pdf files of all of the hydrotechnical reports produced under this program and digital mapping in the form of AutoCAD files for almost all of these areas.
Flood Risk Public Information Maps
| Badger (Current water level information for Badger) | Small JPG Large JPG PDF (1.1 MB) |
| Bishops Falls | Small JPG Large JPG PDF (1.4 MB) |
| Brigus | Small JPG Large JPG PDF (488 KB) |
| Carbonear | Small JPG Large JPG PDF (351 KB) |
| Codroy Valley | Small JPG Large JPG PDF |
| Cox’s Cove | Small JPG Large JPG PDF (1.2 MB) |
| Corner Brook | 1:20 and 1:100 AEP Floodlines (45.0 MB) 1:20 and 1:100 AEP Climate Change Floodlines (47.4 MB) 1:20 (13.0 MB) and 1:100 (13.0 MB) AEP Inundation Floodlines |
| Deer Lake | Small JPG Large JPG PDF (1.2 MB) |
| Ferryland | Small JPG Large JPG PDF (551 KB) |
| Gaudon’s Brook (Kippens) / Cold Brook | Small JPG Large JPG PDF (211 KB) |
| Glenwood / Appleton | Small JPG Large JPG PDF (1 MB) |
| Glovertown | Small JPG Large JPG PDF (980 KB) |
| Goulds / PettyHarbour | 1:20 and 1:100 AEP Floodlines (109 MB) 1:20 and 1:100 AEP Climate Change Floodlines (110 MB) 1:20 (19.4 MB) and 1:100 (19.8 MB) AEP Inundation Floodlines |
| Hant’s Harbour | Small JPG Large JPG PDF (547 KB) |
| Heart’s Delight | Small JPG Large JPG PDF (628 KB) |
| Hickman’s Harbour | Small JPG Large JPG PDF (479 KB) |
| Logy Bay – Middle Cove – Outer Cove | 1:20 and 1:100 AEP Floodlines (252 MB) 1:20 and 1:100 AEP Ultimate Development Floodlines (251 MB) 1:20 and 1:100 AEP Climate Change Floodlines (251 MB) 1:20 (16 MB) and 1:100 (16 MB) AEP Inundation Floodlines |
| Outer Cove | Small JPG Large JPG PDF (367 KB) |
| Parson’s Pond | Small JPG Large JPG PDF (1 MB) |
| Placentia | Small JPG Large JPG PDF (1.2 MB) |
| Portugal Cove-St. Philips | 1:20 and 1:100 AEP Floodlines (175 MB) 1:20 and 1:100 AEP Climate Change Floodlines (177 MB) 1:20 and 1:100 AEP Inundation Floodlines (78 MB) 1:20 and 1:100 AEP Velocity Distribution Floodlines (76 MB) 1:20 and 1:100 AEP Flood Hazard Floodlines (78 MB) |
| Rushoon | Small JPG Large JPG PDF (1.2 MB) |
| Rushy Pond | Small JPG Large JPG PDF (1.1 MB) |
| Salmon Cove | Small JPG Large JPG PDF (416 KB) |
| Shearstown | 1:20 and 1:100 AEP Floodlines (68 MB) 1:20 (68 MB) and 1:100 (68 MB) AEP Climate Change Floodlines 1:20 (2 MB) and 1:100 (2 MB) AEP Inundation Floodlines |
| Shoal Harbour / Hodges Cove | Small JPG Large JPG PDF (514 KB) |
| Steady Brook | Small JPG Large JPG PDF (1.3 MB) |
| Stephenville | Stephenville 1:20 and 1:100 AEP Floodlines (1 MB) 1:100 AEP Climate Change Floodline (1 MB)Cold Brook 1:20 and 1:100 AEP Floodlines (0.4 MB) 1:100 AEP Climate Change Floodline (0.4 MB) |
| Stephenville Crossing/ Black Duck Siding | Stephenville Crossing 1:20 and 1:100 AEP Floodlines (326 MB) 1:20 (97 MB) and 1:100 (97 MB) AEP Climate Change Floodlines 1:20 (4 MB) and 1:100 (5 MB) AEP Inundation FloodlinesBlack Duck Siding 1:20 and 1:100 AEP Floodlines (100 MB) 1:20 (100 MB) and 1:100 (99 MB) AEP Climate Change Floodlines 1:20 (5 MB) and 1:100 (5 MB) AEP Inundation Floodlines |
| Trout River | Small JPG Large JPG PDF (1.2 MB) |
| Victoria | Small JPG Large JPG PDF (553 KB) |
| Waterford River | Small JPG Large JPG PDF (1.1 MB) |
| Whitbourne | Small JPG Large JPG PDF (569 KB) |
| Winterton | Small JPG Large JPG PDF (340 KB) |
Flood Forecasting
We have also made progress in flood preparedness through the establishment of a provincial flood forecasting centre, in particular, for the communities of Steady Brook, Deer Lake and Badger. Precipitation, temperature and flow data are remotely collected from rivers and downloaded to our computers in St. John’s in near-to-real-time via satellite. Here, using state-of-the-art technology in hydrologic modelling, hydraulic modelling, and data management, as well as local observations, we determine forecasts of river flows and water levels for several days. The information is relayed to Emergency Services Division-Newfoundland and Labrador for appropriate action as may be necessary in a potential flooding situation. The terminology that has been developed to assist in reporting on the different rivers states, progressing from an “advisory” to “watch” to “warning”, are:
Spring Runoff Advisory: River levels are rising or expected to rise due to snowmelt and no major flooding is expected. Minor flooding in low-lying areas is possible. Anyone situated near the river affected (property owners and the general public) is advised to be cautious of rising levels.
High River Flow Advisory: River levels are rising or expected to rise rapidly and no major flooding is expected. Minor flooding in low-lying areas is possible. Anyone situated near the river affected is advised to be cautious of the rising levels.
Ice Jam Advisory: The potential exists for sudden increases in river levels both upstream and downstream of the ice jam. Changes in water levels can occur upstream of the jam as water collects behind the jam. If the jam releases suddenly, a surge of water could be sent downstream. Local authorities and residents are advised to monitor the ice covers and water levels in the river, particularly in areas where ice jams have been a problem in the past.
River Breakup Advisory: Generally due to the onset of warmer spring temperatures, the breakup of ice may result in the formation of ice jams. The location and occurrence of ice jams, and possible associated flooding, are very unpredictable. Local authorities and residents are advised to monitor the ice covers and water levels in the river, particularly in areas where ice jams have been a problem in the past.
Flood Watch: River levels are rising and will approach or may exceed river banks. Flooding of areas near the river may occur. Anyone situated near the river affected is advised to take appropriate precautionary measures.
Flood Warning: Rising river levels will result in flooding of areas near the river. Anyone situated near the river affected should take appropriate measures to avoid flood damage.
In the longer term, we undertake flood studies and investigations. These involve collection of hydrologic and hydraulic data, selection of appropriate design philosophies, modelling, post-flooding assessments of damage, and analysis of results. The studies and investigations lead to recommendations for flood control strategies, remedial measures and new flood forecasting systems.
Adobe® Acrobat® Reader software can be used for viewing PDF documents. Download Acrobat® Reader for free.