

- Background
- Churchill River Water Level, Climate and Ice Information
- Water Level and Climate Monitoring
- Churchill River English Point – Water Level Comparison 2017 vs 2021–2025
- Ice Monitoring
- Ice Thickness Monitoring
- Ice Thickness Measurement Using Ground Penetrating Radar
- Ice Thickness Measurement Using Real time ice thickness Monitoring Buoys – SIMBA Units
- Snow Depth Products from Environment and Climate Change Canada
- Mud Lake Crossing Videos
- Churchill River Maps
- Variability of Sandbars and Islands in the Lower Churchill River Over Time
- Churchill River and Watershed Map Link
- Lower Churchill River Map
- Flood of 2017
- Independent Review of Flooding at Mud Lake
- Climate Change Flood Risk Mapping Study And The Development of a Flood Forecasting Service: Happy Valley – Goose Bay and Mud Lake
- News Releases
- Contact Us
Background
The Churchill River is located in the Labrador portion of Newfoundland and Labrador. It flows from the Smallwood Reservoir into Lake Melville draining an area of approximately 94,000 km2.
The upper Churchill River Basin that extends from the upstream basin boundary (i.e. headwaters) to the Churchill Falls Generating Station drains approximately 69,400 km2. Nearly 90 dams and dikes in the upper Churchill River basin direct flows to the Churchill Falls Generating Station. Prior to passing through the Churchill Falls Generating Station, water is stored in the approximately 7,000 km2 Smallwood Reservoir. The upper Churchill River basin includes several large lakes and tributaries, including Lobstick Lake, Michikatamu Lake, Atikonak River, McPhayden River, Ashuanipi River, McKenzie River, and Kepimits River (Reference Independent Review of Flooding at Mud Lake, 2017).
The middle Churchill River basin, which extends from the Churchill River Generating Station to the Muskrat Falls Generating Station Development, drains approximately 92,500 km2, of which 23,050 km2 is local drainage. Flow in the middle basin is largely regulated by the outflows from the Churchill Fall Generating Station; however local flow contributions due to snow melt and rainfall can represent a significant portion of the flow contribution in the basin. Major tributaries in the middle Churchill River Basin include Pinus River, Fig River, Metchin River, Lower Brook and Upper Brook (Reference Independent Review of Flooding at Mud Lake, 2017).
The lower Churchill River basin drains approximately 94,320 km2, of which approximately 1,850 km2 is local drainage. Flow in the lower basin is governed by outflows from the Churchill Falls Generating Station and local flow contributions from the middle and lower basins. The lower Churchill River basin conveys flow into Lake Melville prior to ultimately being conveyed to the Atlantic Ocean (Independent Review of Flooding at Mud Lake, 2017).
Churchill River Water Level, Climate and Ice Information
Due to the volume and frequent updating of the water level and other data made available on this web site this data is considered to be PROVISIONAL because it has not undergone quality control checks. These data may be subject to significant change.
Water Level and Climate Monitoring
The Water Resources Management Division (WRMD) monitors a series of hydrometric, climate and snow monitoring stations in the Churchill River Basin and uses the information collected for monitoring the river. The information from these stations can be seen here:
Quick View of the Churchill River Basin Near Real Time Data
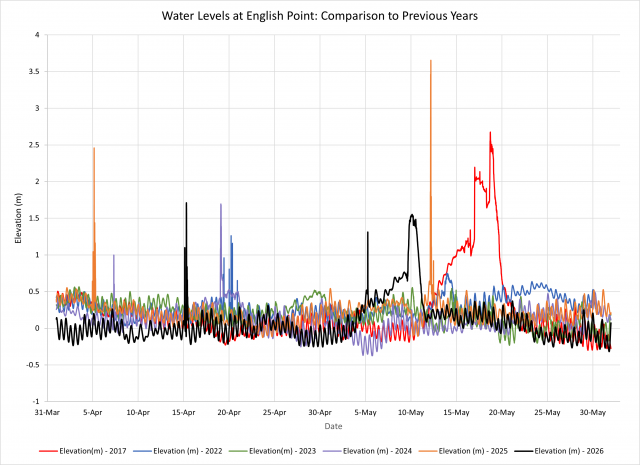
Churchill River English Point – Water Level Comparison 2017 vs 2022-2026
Water levels at English Point have been graphed for 2022-2026 from April 1st to May 31st. Please note that this station had an assumed elevation at the time of flooding in 2017 and was not geodetically tied-in (i.e., it was a measurement used to show the change in water level only). In 2019, it was surveyed and the elevations are now geodetic. For purposes of creating this graph a correction offset of (-)2.210 m has been applied to the 2017 data. Monitoring the water levels at this point on the river show the water level rising due to ice build-up and then water levels dropping from when the ice cleared out.
Ice Monitoring
The WRMD uses a satellite-based river ice monitoring service that provides information on the location, extent and structure of river ice covers. The primary data source is satellite-based synthetic aperture radar (SAR) imagery. SAR technology is not affected by cloud cover and does not rely on the sun as a source of illumination. This means, images can be acquired day or night, independent of atmospheric conditions.
The river ice monitoring service is based on a combination of visual interpretation and semi-automatic processing of SAR imagery in near real-time. The processed imagery provides the following products:
-
- Ice cover location
- Interpretive ice classes
- Open water
- Non-consolidated or intact ice
- Rafted/consolidated ice
- Change in Ice Cover
The Ice Cover, Ice Classification, and Change Detection Products and SIMBA ice thickness readings are also available on this interactive webpage – https://www.churchillriver.app/
A user manual for the website is available here
Satellite Based RADAR Images and ice products for Lower Churchill River
Ice Thickness Monitoring
| Date | Ice Thickness Measurements |
|---|---|
| 2025/26 Monitoring Season | |
| Apr 28-29, 2026 | Report |
| Apr 1, 2026 | Report |
| Mar 17-18, 2026 | Report |
| Feb 3-4, 2026 | Report |
| Jan 6-7, 2026 | Report |
| Dec 16-17, 2025 | Report |
| 2024/25 Monitoring Season | |
| Apr 23, 2025 | Report |
| Mar 31 – Apr 2, 2025 | Report |
| Mar 18-19, 2025 | Report |
| Mar 4-5, 2025 | Report |
| Feb 20, 2025 | Report |
| Feb 06, 2025 | Report |
| Jan 23, 2025 | Report |
| Dec 10, 2024 | Report |
| 2023/24 Monitoring Season | |
| Apr 29, 2024 | Report |
| Apr 16-17, 2024 | Report |
| Apr 2-3, 2024 | Report |
| Mar 19-20, 2024 | Report |
| Mar 5-6, 2024 | Report |
| Feb 20-21, 2024 | Report |
| Feb 6-7, 2024 | Report |
| Jan 23-24, 2024 | Report |
| Jan 9-10, 2024 | Report |
| 2022/23 Monitoring Season | |
| Apr 11-12, 2023 | Report |
| Mar 28-29, 2023 | Report |
| Feb 21-22, 2023 | Report |
| Feb 7-8, 2023 | Report |
| Jan 24-25, 2023 | Report |
| Jan 10-11, 2023 | Report |
| 2021/22 Monitoring Season | |
| May 11-12, 2022 | Report |
| Apr 26, 2022 | Report |
| Apr 14, 2022 | Report |
| Mar 29, 2022 | Report |
| Mar 15-16, 2022 | Report |
| Mar 1-2, 2022 | Report |
| Feb 15-16, 2022 | Report |
| Feb 1-2, 2022 | Report |
| Jan 18-20, 2022 | Report |
| Jan 4-5, 2022 | Report |
| Dec 14, 2021 | Report |
| 2020/21 Monitoring Season | |
| Apr 12, 2021 | Report |
| Mar 30-31, 2021 | Report |
| Mar 17-18, 2021 | Report |
| Mar 1, 2021 | Report |
| Feb 16, 2021 | Report |
| Feb 1, 2021 | Report |
| Jan 5, 2021 | Report |
| 2019/20 Monitoring Season | |
| May 12, 2020 | Report |
| Apr 22, 2020 | Report |
| Apr 13, 2020 | Report |
| Feb 25-26, 2020 | Report |
| Feb 11-12, 2020 | Report |
| Jan 28-29, 2020 | Report |
| Jan 8-9, 2020 | Report |
| Dec 17-18, 2019 | Report |
| Dec 3, 2019 | Report |
| 2018/19 Monitoring Season | |
| May 9-10, 2019 | Report |
| May 1, 2019 | Report |
| Apr 17, 2019 | Report |
| Apr 3, 2019 | Report |
| Mar 20-21, 2019 | Report |
| Mar 13-14, 2019 | Report |
| Mar 6, 2019 | Report |
| Feb 27, 2019 | Report |
| Feb 20, 2019 | Report |
| Feb 14, 2019 | Report |
| Feb 6-7, 2019 | Report |
| Jan 9, 2019 | Report |
| Dec 20, 2018 | Report |
| Dec 11-12, 2018 | Report |
| Nov 29, 2018 | Report |
| 2017/18 Monitoring Season | |
| May 1-3, 2018 | Report |
| Apr 17-19, 2018 | Report |
| Apr 3-4, 2018 | Report |
| Mar 21-22, 2018 | Report |
| Mar 7-8, 2018 | Report |
| Feb 20-22, 2018 | Report |
| Feb 6-7, 2018 | Report |
| Jan 23, 2018 | Report |
| Jan 16-17, 2018 | Report |
| Dec 16, 2017 | Report |
Additional Ice Thickness Measurements undertaken
| Date | Ice Thickness Measurements |
|---|---|
| 2025/26 Monitoring Season | |
| Apr 28-29, 2026 | Report |
| Apr 1, 2026 | Report |
| Mar 17-18, 2026 | Report |
| Feb 3-4, 2026 | Report |
| Jan 6-7, 2026 | Report |
| Dec 16-17, 2025 | Report |
| 2024/25 Monitoring Season | |
| Apr 23, 2025 | Report |
| Mar 31-Apr 2, 2025 | Report |
| Mar 18-19, 2025 | Report |
| Mar 4-5, 2025 | Report |
| Feb 20, 2025 | Report |
| Feb 06, 2025 | Report |
| Jan 23, 2025 | Report |
| Dec 10, 2024 | Report |
| 2023/24 Monitoring Season | |
| Apr 29, 2024 | Report |
| Apr 16-17, 2024 | Report |
| Apr 2-3, 2024 | Report |
| Mar 19-20, 2024 | Report |
| Mar 5-6, 2024 | Report |
| Feb 20-21, 2024 | Report |
| Feb 6-7, 2024 | Report |
| Jan 23-24, 2024 | Report |
| Jan 9-10, 2024 | Report |
| 2022/23 Monitoring Season | |
| Apr 11-12, 2023 | Report |
| Mar 28-29, 2023 | Report |
| Feb 21-22, 2023 | Report |
| Feb 7-8, 2023 | Report |
| Jan 24-25, 2023 | Report |
| Jan 10-11, 2023 | Report |
| 2021/22 Monitoring Season | |
| May 11-12, 2022 | Report |
| Apr 26, 2022 | Report |
| Apr 14, 2022 | Report |
| Mar 29, 2022 | Report |
| Mar 15-16, 2022 | Report |
| Mar 1-2, 2022 | Report |
| Feb 15-16, 2022 | Report |
| Feb 1-2, 2022 | Report |
| Jan 18-20, 2022 | Report |
| Jan 4-5, 2022 | Report |
| Dec 14, 2021 | Report |
| 2020/21 Monitoring Season | |
| Apr 12, 2021 | Report |
| Mar 30-31, 2021 | Report |
| Mar 17-18, 2021 | Report |
| Mar 1, 2021 | Report |
| Feb 16, 2021 | Report |
| Feb 1, 2021 | Report |
| Jan 5, 2021 | Report |
| 2019/20 Monitoring Season | |
| May 12, 2020 | Report |
| Apr 22, 2020 | Report |
| Apr 13, 2020 | Report |
| Feb 25-26, 2020 | Report |
| Feb 11-12, 2020 | Report |
| Jan 28-29, 2020 | Report |
| Jan 8-9, 2020 | Report |
| Dec 17-18, 2019 | Report |
| Dec 3, 2019 | Report |
| 2018/19 Monitoring Season | |
| May 9-10, 2019 | Report |
| May 1, 2019 | Report |
| Apr 17, 2019 | Report |
| Apr 3, 2019 | Report |
| Mar 20, 2019 | Report |
| Mar 13, 2019 | Report |
| Mar 6, 2019 | Report |
| Feb 27, 2019 | Report |
| Feb 20, 2019 | Report |
| Feb 14, 2019 | Report |
| Feb 6, 2019 | Report |
| Jan 9, 2019 | Report |
| Dec 20, 2018 | Report |
| Dec 11-12, 2018 | Report |
Ice Thickness Measurement Using Ground Penetrating Radar
Ice surveillance activities on the Lower Churchill River are being carried out using new technology – helicopter-based ground penetrating radar (GPR) measurements. GPR is commonly used for on-ground geology investigations but using it on an airborne platform is a new application that is being developed for ice thickness measurement.
During the ice thickness survey the helicopter flies above the river and the GPR sensor emits a radar signal which is transmitted through the air and into the layers of snow, ice and underlying water. At the boundary between each layer the radar signal is reflected back to the GPR and recorded. This shows the air, water and ice layers. Ice thickness is calculated as the difference between the air/ice and the ice/water boundaries.
In order to validate the helicopter-based GPR readings, field measurements of ice thickness are collected during the helicopter surveys, where possible, to validate the GPR measurements.
| Date | Ice Thickness Measurements Using GPR |
|---|---|
| 2024/25 Monitoring Season | |
| Feb 13, 2025 | Ice Thickness |
| 2023/24 Monitoring Season | |
| Feb 21, 2024 | Ice Thickness |
| 2022/23 Monitoring Season | |
| Feb 12, 2023 | Ice Thickness |
| 2021/22 Monitoring Season | |
| Feb 7, 2022 | Ice Thickness |
| 2018/19 Monitoring Season | |
| Mar 27, 2019 | Ice Thickness |
| 2017/18 Monitoring Season | |
| Apr 23, 2018 (The wet snow, a consequence of the previous week’s warmer weather, meant that ice thickness could not be reliably extracted from the GPR data.) |
Ice Thickness Borehole Measurements |
| Mar 6, 2018 | Ice Thickness |
Ice Thickness Measurement Using Real time ice thickness Monitoring Buoys – SIMBA Units
Ice thickness observations are required as an input to the Lower Churchill River Flood Forecasting System. To collect this data, four ice mass balance array units (SIMBA units – Scottish Association for Marine Science Ice Mass Balance Array) have been installed on the ice of the Churchill River. These will be removed prior to the ice break up. These SIMBA units are a proven technology to determine snow depth and ice thickness. Every six hours air, snow, ice, and water temperature data will be collected automatically by each of the SIMBAs and transmitted via the Iridium satellite communications network along with GPS data. From this data, snow and ice thickness will be determined.
The SIMBA Locations are as follows
The SIMBA ice thickness readings are made available by C-CORE on the following webpage www.churchillriver.app.
A user manual for the website is available here
Mud Lake Crossing Videos
| Date | Videos |
|---|---|
| 2017/18 Monitoring Season | |
| Feb 25, 2018 | Courtesy of Dave Raeburn (0.8 GB) Courtesy of Dave Raeburn (0.7 GB) |
| 2016/17 Monitoring Season | |
| Feb 25, 2017 | Courtesy of Dave Raeburn (1.2 GB) |
Churchill River Maps
Variability of Sandbars and Islands in the Lower Churchill River Over Time
Cloud-free LANDSAT imagery collected since 1972 were analyzed to evaluate the occurrence of sandbars and islands in the Lower Churchill River. By limiting valid acquisition dates to October/early November, an attempt was made to select only images acquired before the onset of ice formation. A new sandbar map will be added every year in October/early November.
Please note that the base map is provided for reference only and does reflect the historical conditions at the time of image acquisition.
| Satellite Image Acquisition Date | Satellite Sensor | Spatial Resolution (m) |
|---|---|---|
| Oct 04, 1972 | LANDSAT 1 MSS | 80 |
| Oct 09, 1976 | LANDSAT 5 MSS | 80 |
| Oct 13, 1984 | LANDSAT 5 TM | 30 |
| Oct 12, 1986 | LANDSAT 5 MSS | 80 |
| Oct 11, 1989 | LANDSAT 5 MSS | 80 |
| Oct 18, 1994 | LANDSAT 5 TM | 30 |
| Oct 10, 2003 | LANDSAT 7 ETM | 30 |
| Oct 04, 2004 | LANDSAT 5 TM | 30 |
| Oct 31, 2005 | LANDSAT 7 ETM | 30 |
| Oct 23, 2008 | LANDSAT 7 ETM | 30 |
| Oct 27, 2009 | LANDSAT 5 TM | 30 |
| Oct 21, 2010 | LANDSAT 5 TM | 30 |
| Oct 18, 2012 | LANDSAT 7 ETM | 30 |
| Oct 24, 2014 | LANDSAT 7 ETM | 30 |
| Oct 03, 2015 | LANDSAT 8 OLI | 30 |
| Oct 05, 2016 | LANDSAT 8 OLI | 30 |
| Nov 09, 2017 | LANDSAT 8 OLI | 30 |
| Nov 05, 2018 | Sentinel-2 | 30 |
| Oct 11, 2019 | Sentinel-2 | 30 |
| Oct 30, 2020 | Sentinel-2 | 30 |
| Oct 30, 2021 | Sentinel-2 | 30 |
| Oct 25, 2022 | Sentinel-2 | 30 |
| Nov 14, 2023 | Sentinel-2 | 10 |
| Oct 24, 2024 | Sentinel-2 | 10 |
| Nov 03, 2025 | Sentinel-2 | 30 |
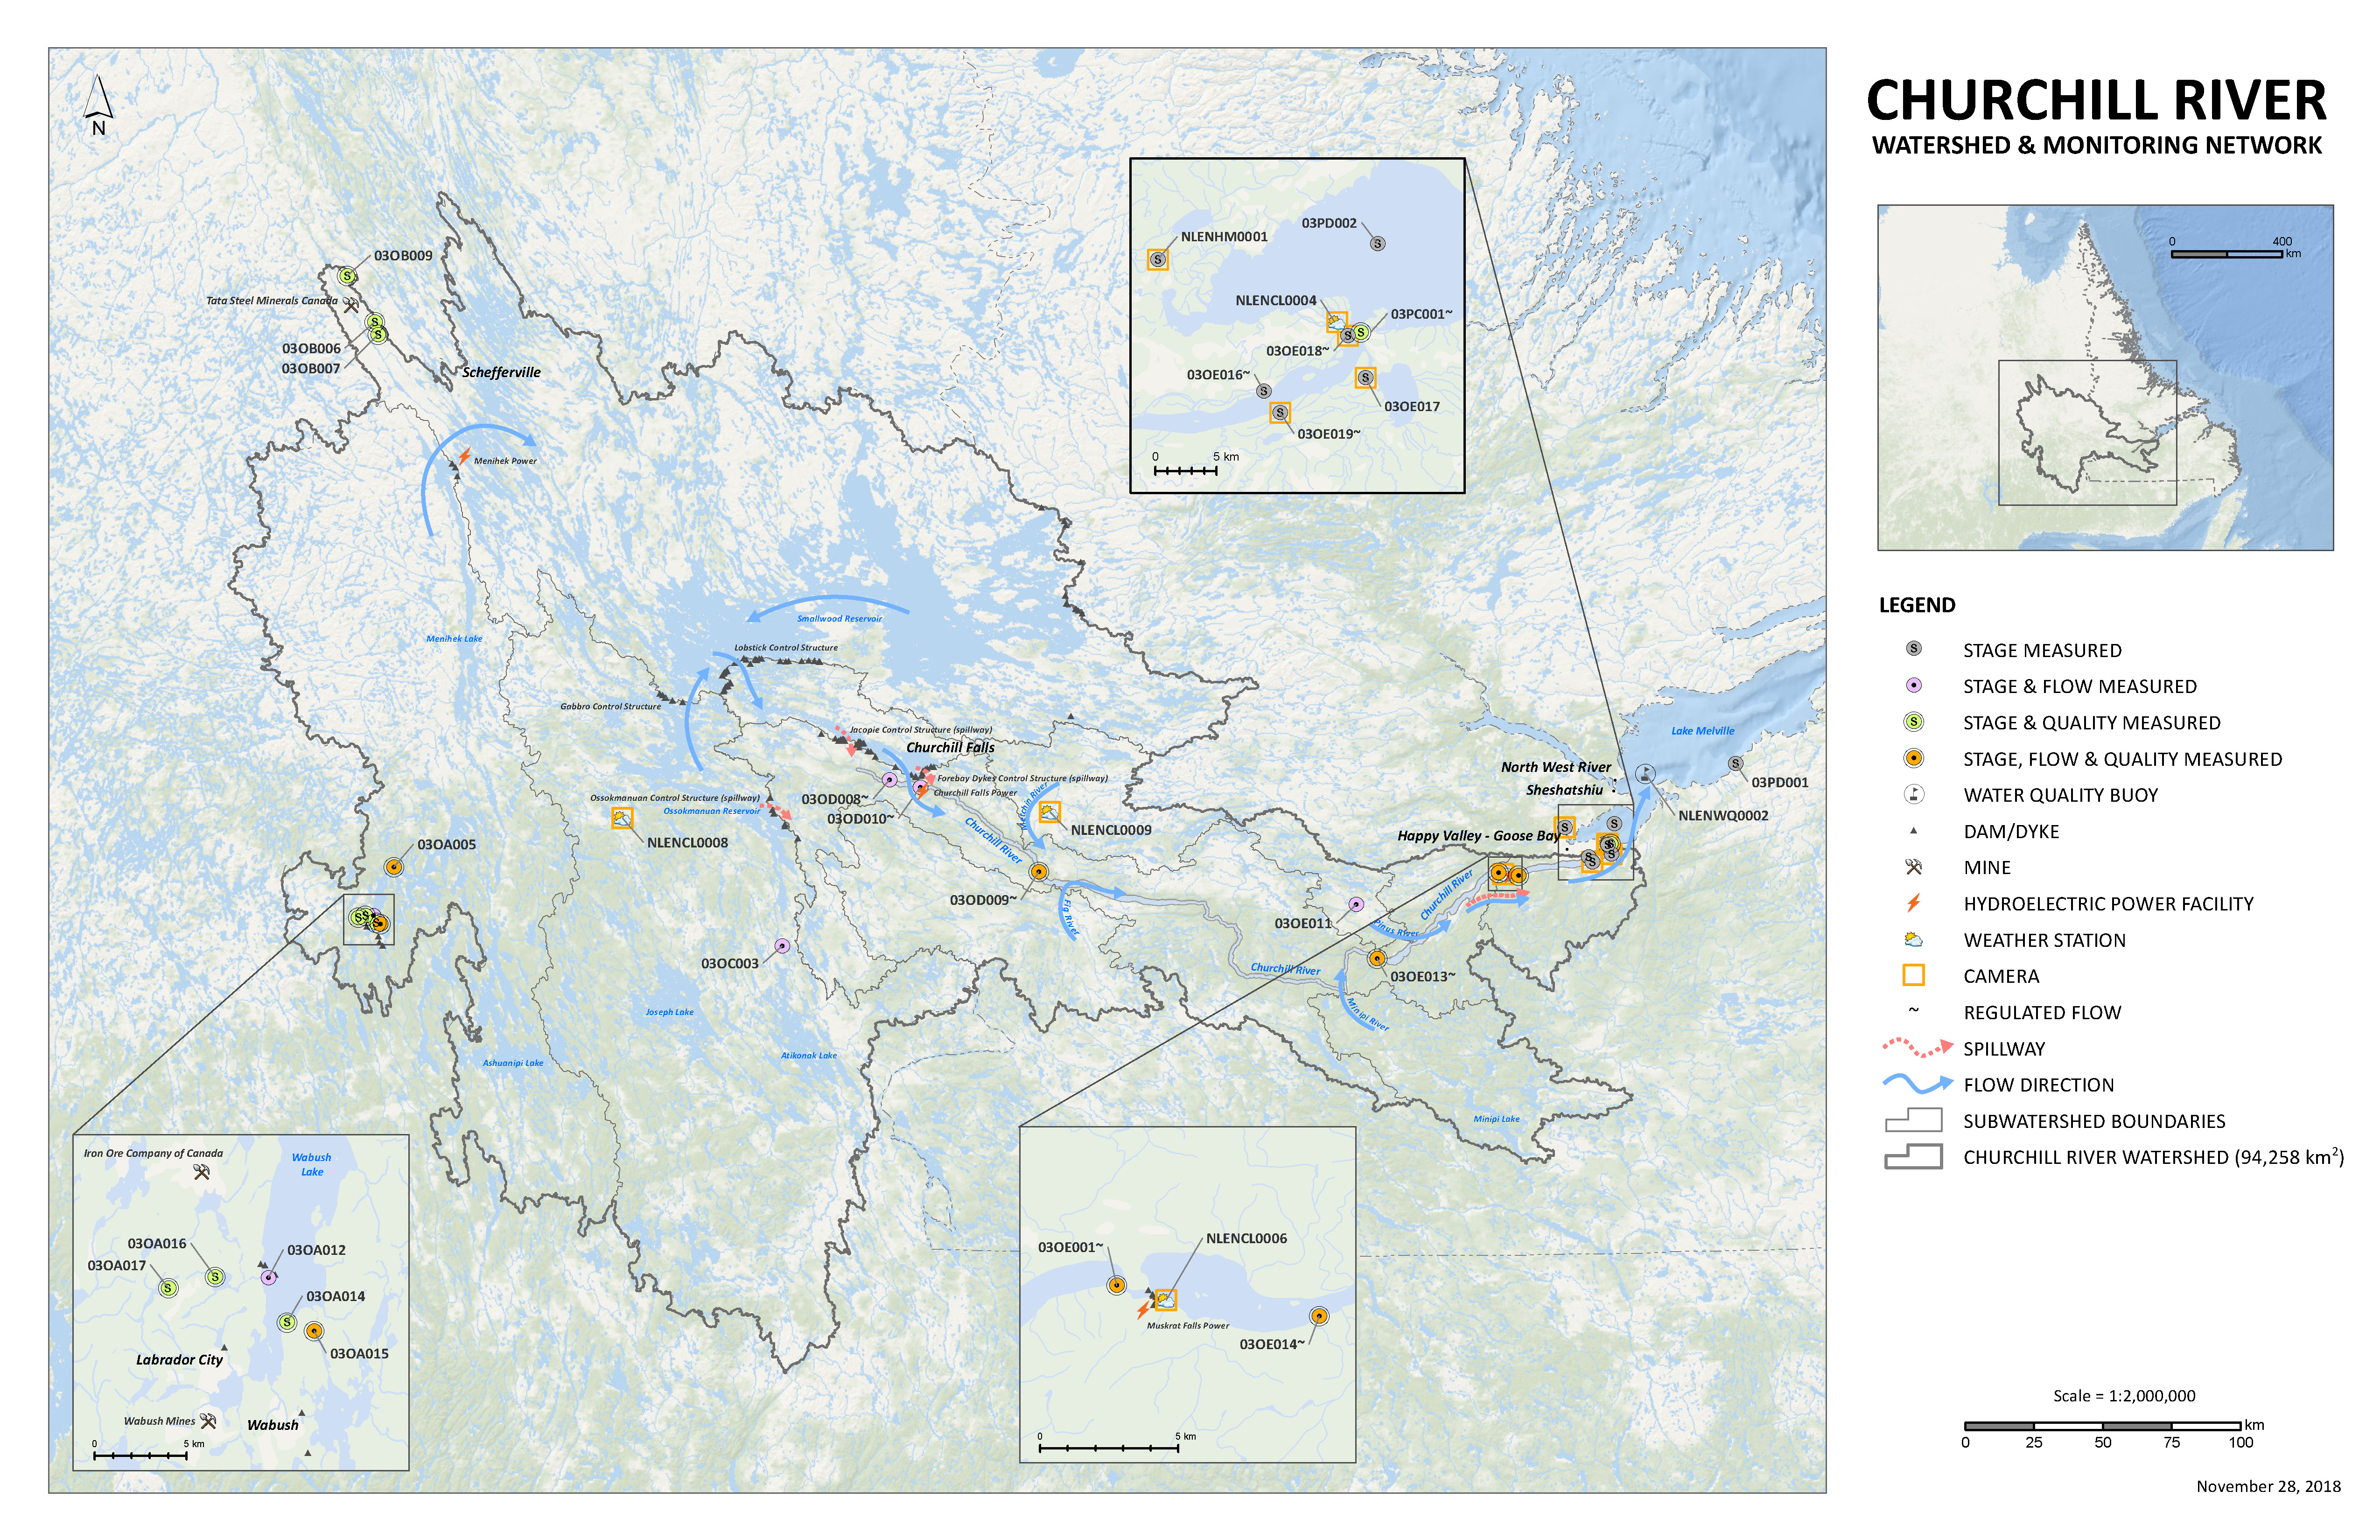
Churchill River and Watershed Map
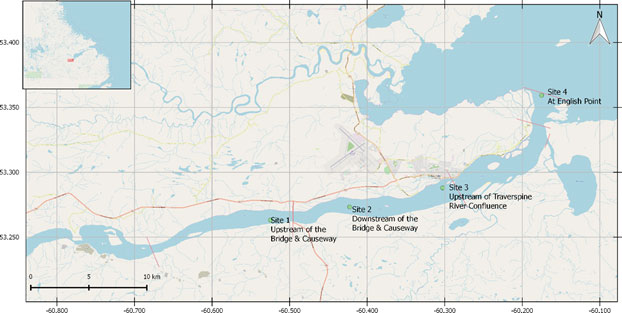
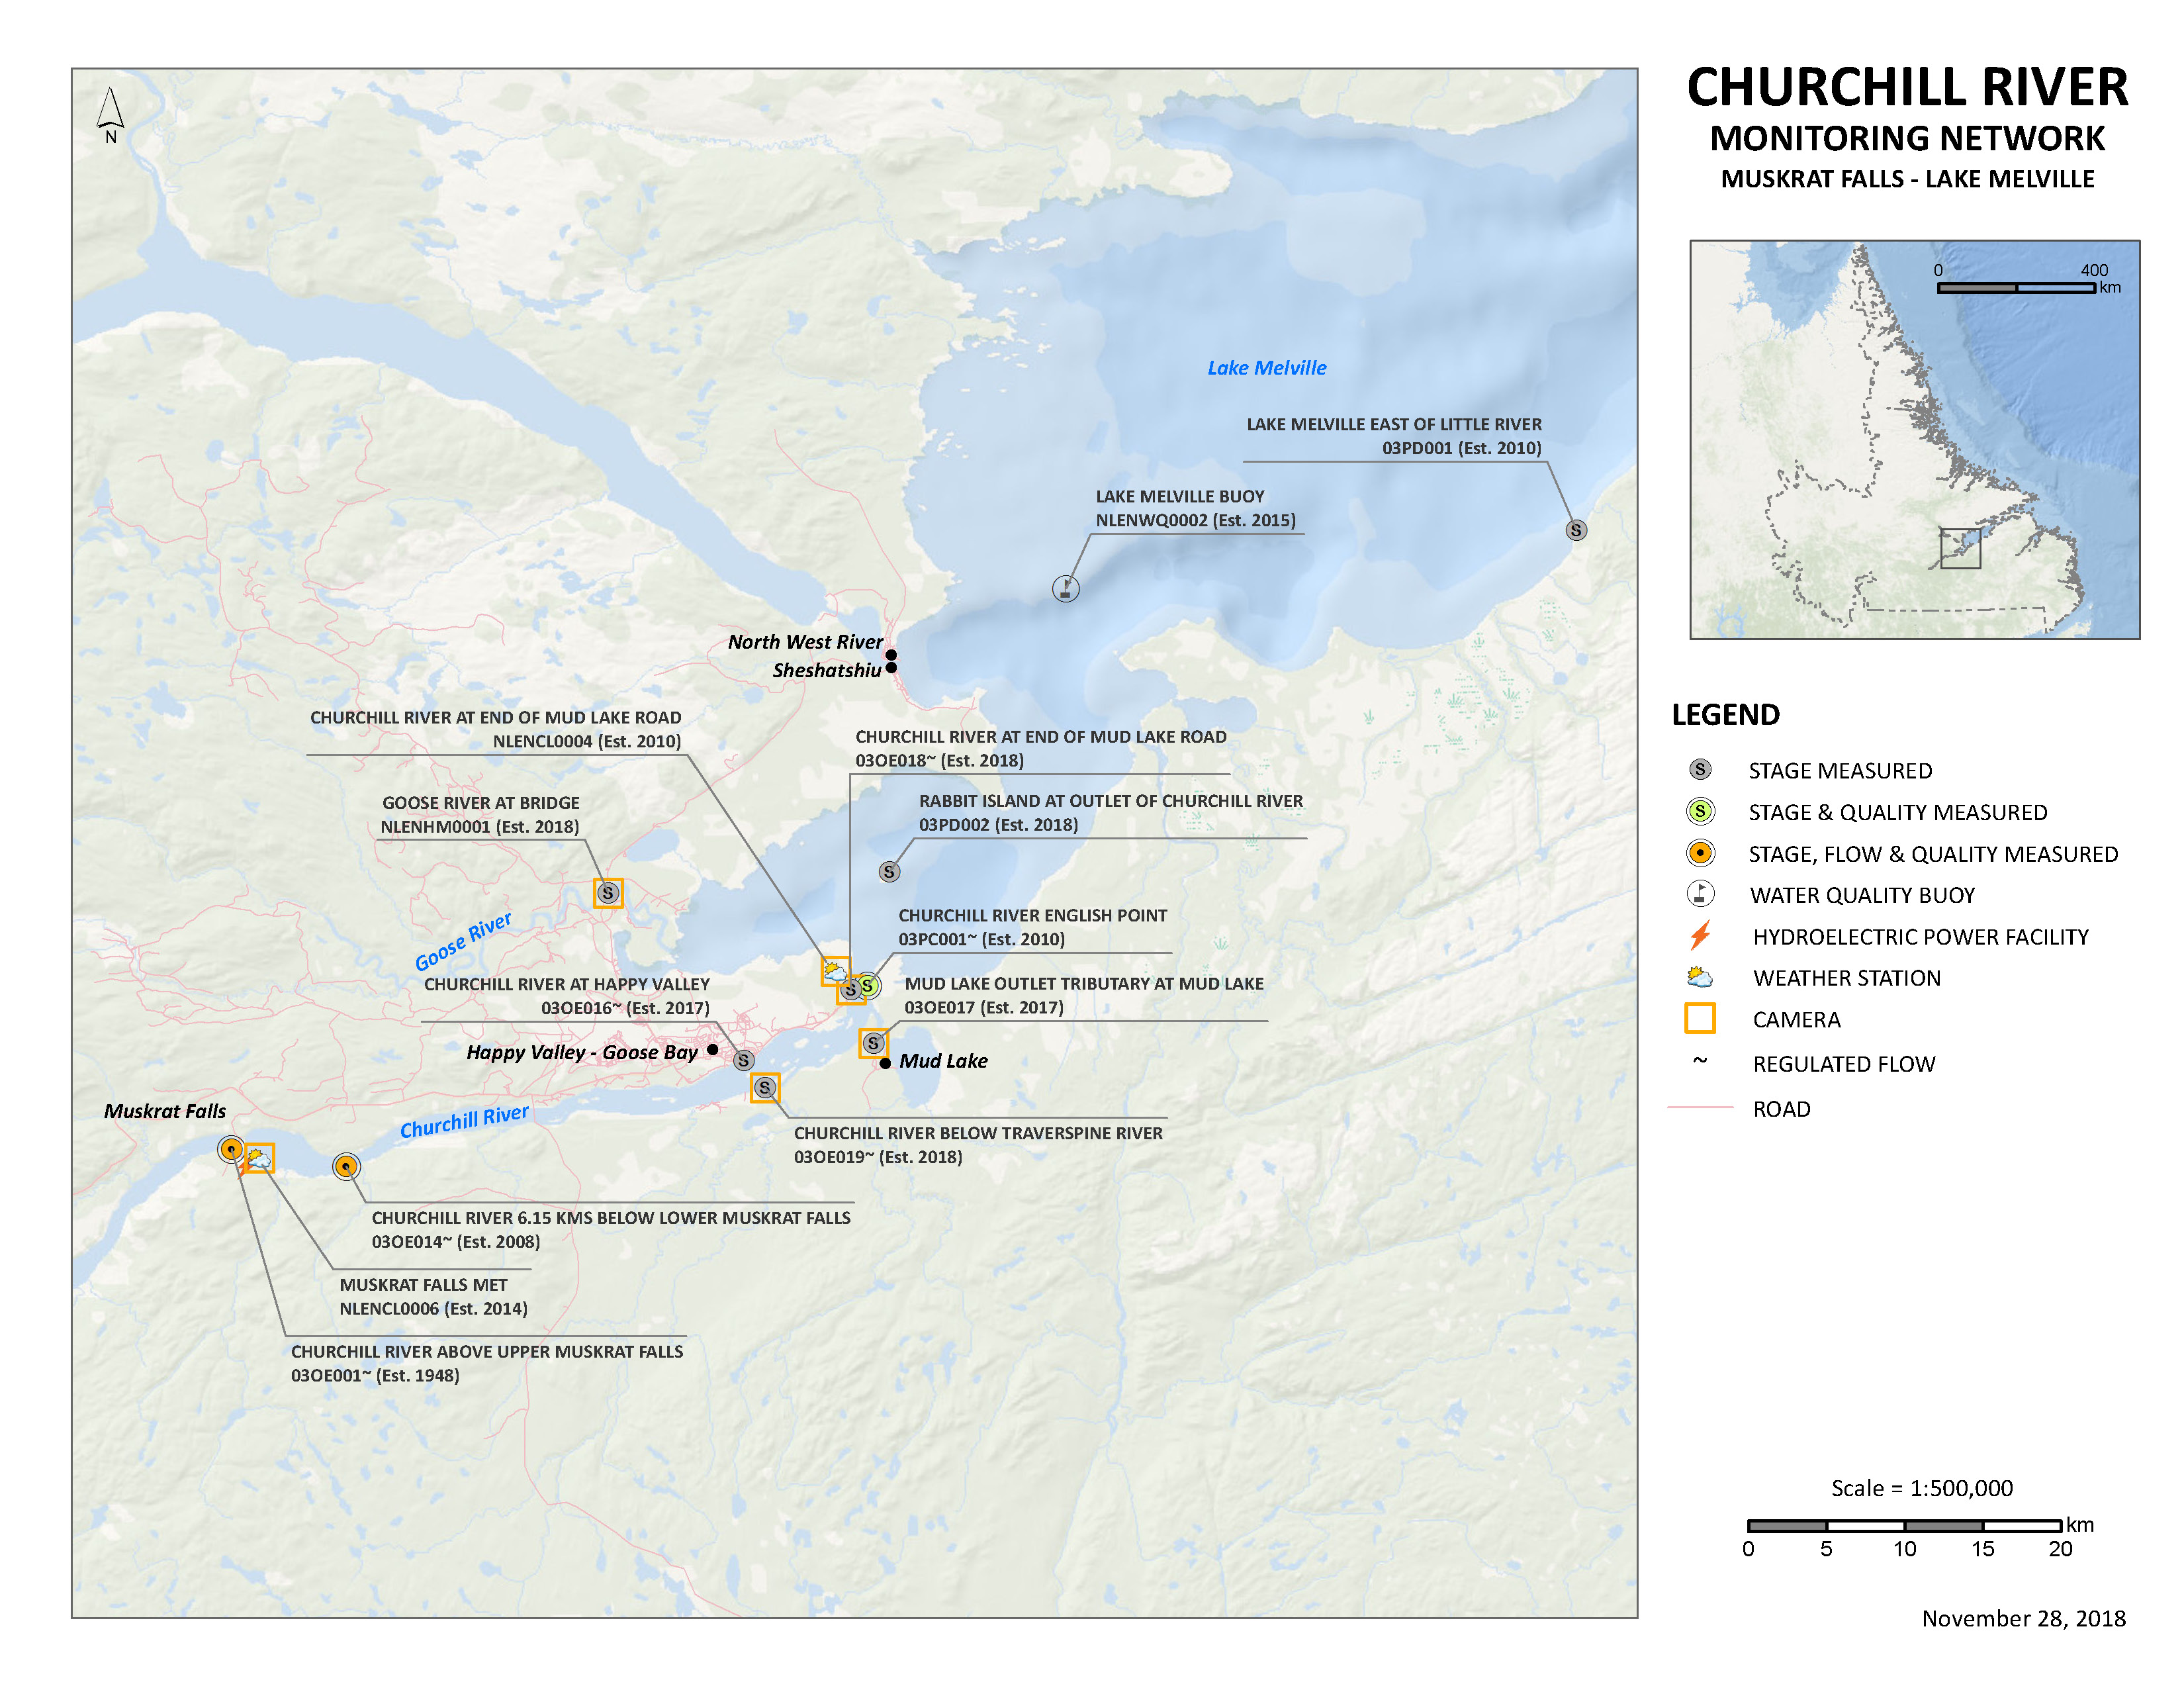
Lower Churchill River Map
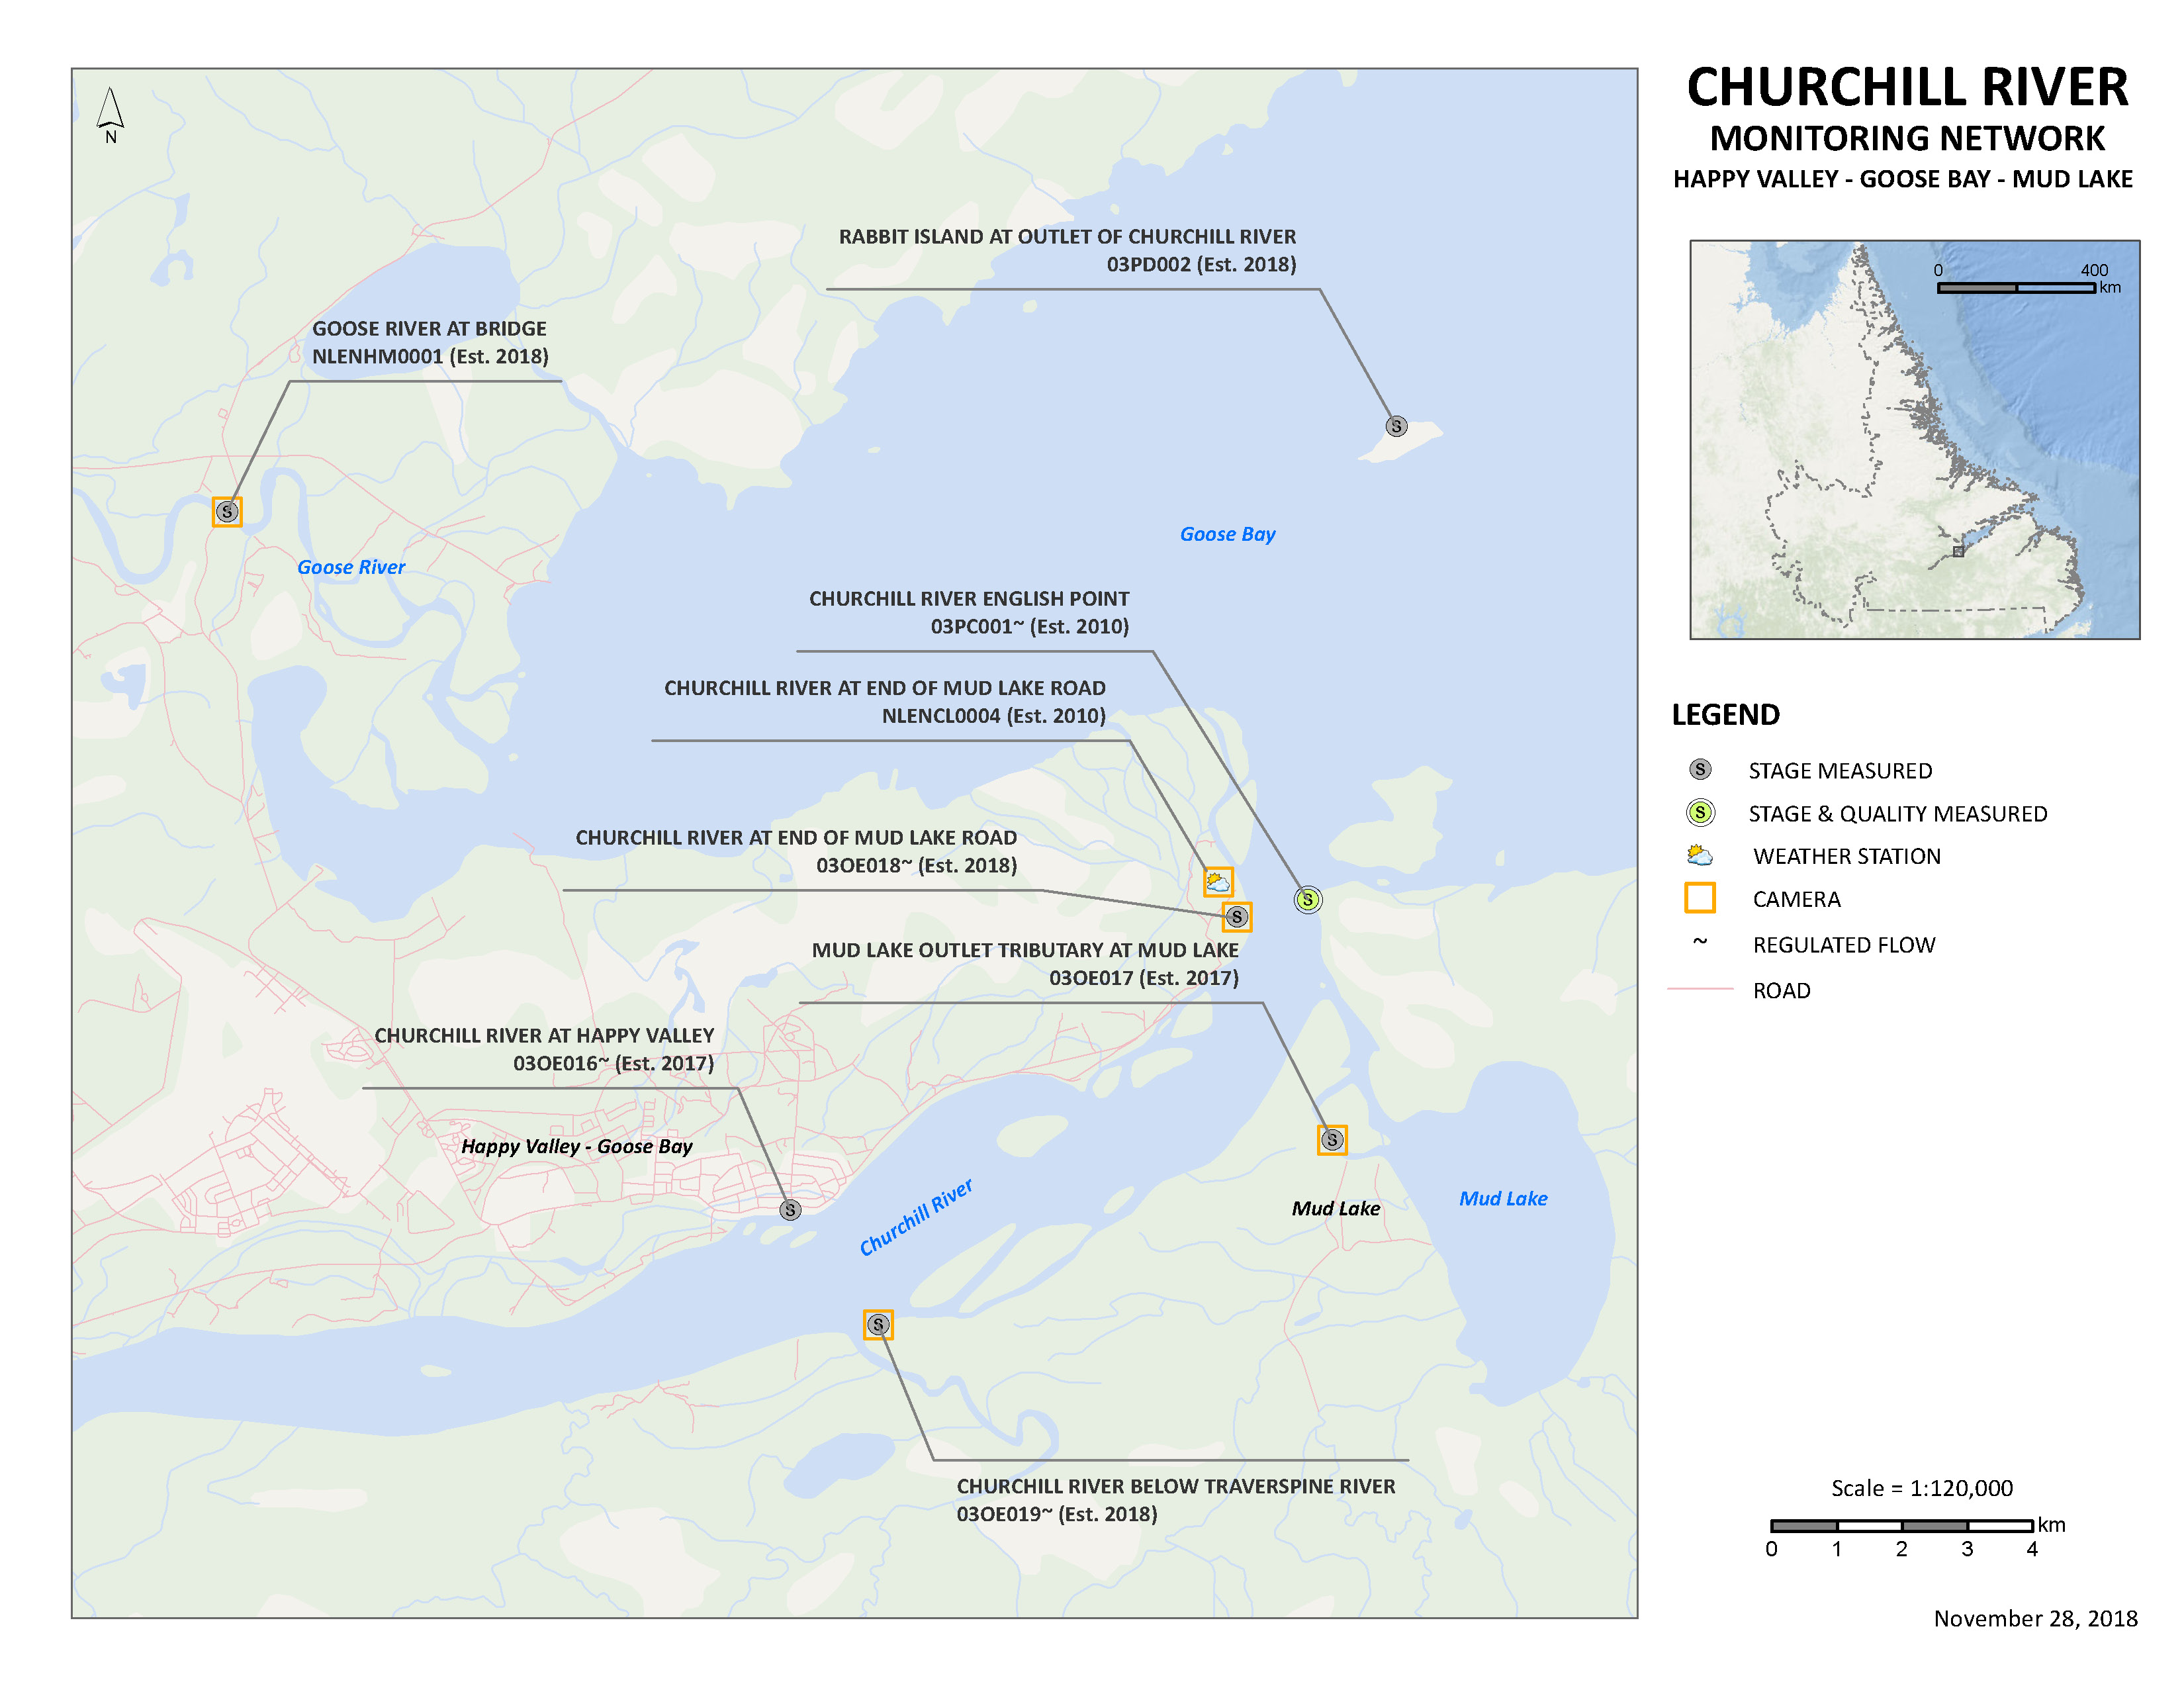
Happy Valley – Goose Bay – Mud Lake Map
Flood of 2017
As reported by the hydrometric station at English Point, water levels started increasing in the Churchill River on May 11th, 2017 Water levels began rising in Mud Lake on May 16th, 2017. The water rose to levels deemed unsafe on the early hours of May 17th, 2017 and the evacuation of residents from Mud Lake to Happy Valley-Goose Bay was initiated.
Stage at English Point Water Level Station on Churchill River
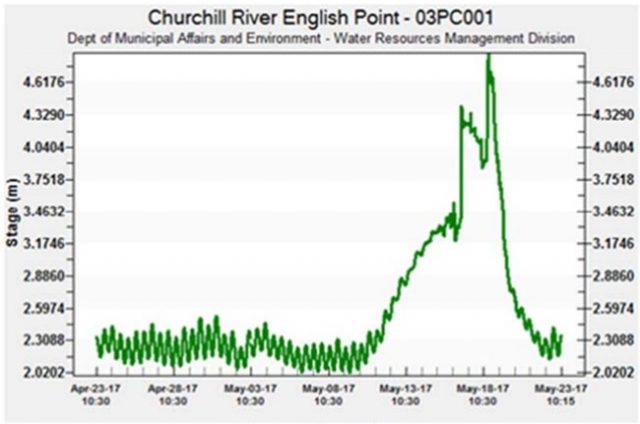
Extensive flooding was also reported in the Mud Lake Road region north of Happy Valley – Goose Bay on the western side of the Churchill River. Damage to properties in both areas was significant.
The Government of Newfoundland and Labrador committed to an independent review of the May 17, 2017 flooding event.
Independent Review of Flooding at Mud Lake
On June 14, 2017, the Provincial Government announced the appointment of an independent expert, Dr. Karl-Erich Lindenschmidt, to lead an assessment of the cause of extensive flooding at Mud Lake that occurred on May 17, 2017. Dr. Lindenschmidt was supported by engineering consultant KGS Group in undertaking an independent and specialized review of the flooding. On September 29, 2017, Dr. Lindenschmidt submitted his final report to the Provincial Government:
Terms of Reference (2 MB)
Final Report (42 MB)
Climate Change Flood Risk Mapping Study And The Development of a Flood Forecasting Service: Happy Valley – Goose Bay and Mud Lake
Background:
In the early morning of May 17, 2017, an ice jam flood occurred on the lower Churchill River at the river’s outlet into Goose Bay. The event required evacuation of the Mud Lake community. Subsequent to this flooding event, the Government of Newfoundland and Labrador engaged an Independent Expert Technical Advisor (IETA) to determine the reasons for the flooding event, taking into consideration local knowledge from residents of the impacted area, and to provide guidance on what actions can be taken to avoid or mitigate impacts of potential future flooding.
The IETA report was submitted in September 2017. The results indicated that the May 17, 2017 flood was a natural event though quite pronounced in magnitude due to a number of natural weather related factors. The outcome determined that the cumulative impact of a number of factors resulted in unusually high river flow conditions. The IETA recommended the implementation of a Flood Management Plan that includes Flood Forecasting and Flood Risk Mapping.
Following on this recommendation, a request for Proposals for a “Climate Change Flood Risk Mapping Study and the Development of a Flood Forecasting Service: Happy Valley – Goose Bay and Mud Lake” was issued in April 2018. The contract for this study was awarded to KGS Group in June 2018. For more details please see https://www.releases.gov.nl.ca/releases/2018/mae/0611n04.aspx
Flood Risk Mapping:
The flood risk mapping study and the flood risk mapping were expected to be completed by March 31, 2019. However, due to weather conditions, aerial photography and LiDAR could not be acquired until September 2019 and the flood risk mapping study completion was delayed until August 2020. Draft flood extent maps were reviewed by the Local River Watch Committee and the Town of Happy Valley-Goose Bay before they were finalized after incorporating the feedback received.
Flood risk maps were developed for the open water and ice-affected 20 and 100 year floods on the Churchill River for current climate and climate change conditions. The flood risk mapping was defined based on the simulated water levels from the hydraulic models, which were overlaid on top of the bare earth digital elevation model, with the aerial imagery shown as the mapping background.
In addition to the flood risk maps, comparison maps showing the differences between the current climate and climate change conditions for each flood were developed to clearly indicate the anticipated changes to the flood risk associated with climate change. Separate maps were also developed showing infrastructure affected by flooding for each condition.
In addition to the flood risk maps, flood hazard maps, which included sets of maps showing the velocity, depth and flood hazard, were developed for the open water and ice-affected 20 and 100 year floods for current climate conditions.
A similar approach was followed to define flood risk maps on Otter Creek and seven unnamed creeks in Happy Valley – Goose Bay for 20 and 100 year rainfall events for both current climate and climate change conditions. Flood hazard maps, which included sets of maps showing velocity, depth, and flood hazard, were also developed for the 20 and 100 year flood events under current climate conditions.
Flood Forecasting:
A comprehensive Lower Churchill River Flood Forecasting System (CRFFS) was developed and deployed on May 1, 2019. It is in operational use and is used to provide daily alerts to Mud Lake and Happy Valley-Goose Bay. The automated flood forecasting tool, CRFFS, is the first system in the country to incorporate real-time remote sensing data with real-time water flows, ice thickness, and weather data. The CRFFS runs once a day and provides 72-hour water levels for Churchill River from Muskrat Falls to English Point for all conditions – open water, ice generation, ice break up, and ice jams. The system tells the Local River Watch Committee and first responders where water levels will exceed river banks in the next 72 hours.
The CRFFS runs year-round and provides forecast flows and water levels at key locations on the Churchill River, and automatically adjusts the forecast to consider freezeup, stable winter, breakup and open water conditions based on real-time monitoring of ice coverage and water temperature data. The CRFFS automatically retrieves meteorological, hydrometric, and ice thickness and coverage data on a user-defined schedule, stores the data in a database, and preprocesses this data for use in the hydrologic and hydraulic forecasting models. The hydrologic model incorporated into the forecasting system was based on the hydrologic model developed for the flood risk mapping, but optimized to work with available meteorological forecasting data. The open water hydraulic model incorporated into the system was optimized for defining forecast water levels at key locations along the river based on the forecast discharge from Muskrat Falls and Lake Melville water levels. The ice-affected hydraulic model runs a Monte Carlo assessment considering the forecast flow at Muskrat Falls, Lake Melville water level, and ice thickness and cover conditions, and provides a range of forecast water levels representing how favorable conditions are in the ensuing days. The forecast water levels are compared to threshold values stored in the forecasting system, and will trigger an alert to specified contacts if the forecast water levels exceed those threshold values. This brochure describes the Churchill River Flood Forecasting System.
The complete study report including maps is available on the Department’s Flood Risk Mapping Studies / Public Information Maps webpage at https://www.gov.nl.ca/eccc/waterres/flooding/frm/
News Releases
May 22, 2017 – Public Advisory: Financial Assistance for Residents of Mud Lake Affected by Flooding
https://www.releases.gov.nl.ca/releases/2017/ma/0522n01.aspx
May 31, 2017 – Lodging Provided to Mud Lake Residents Displaced by Flooding
https://www.releases.gov.nl.ca/releases/2017/ma/0531n07.aspx
June 14, 2017 – Provincial Government Announces Appointment to Lead Assessment of Flooding at Mud Lake
https://www.releases.gov.nl.ca/releases/2017/exec/0614n01.aspx
June 29, 2017 – Extension of Lodging Provided at 5 Wing Goose Bay to Mud Lake Residents Displaced by Flooding
https://www.releases.gov.nl.ca/releases/2017/ma/0629n03.aspx
July 17, 2017 – Contract Awarded to Engineering Consultant for Assessment of Flooding at Mud Lake
https://www.releases.gov.nl.ca/releases/2017/ma/0717n06.aspx
July 20, 2017 – Provincial Government Continues to Assist Residents of Mud Lake
https://www.releases.gov.nl.ca/releases/2017/ma/0720n10.aspx
August 15, 2017 – Provincial Government Provides Update on Disaster Assistance Funding Program for Mud Lake Residents
https://www.releases.gov.nl.ca/releases/2017/ma/0815n05.aspx
October 2, 2017 – Provincial Government Releases Report from Independent Assessment of Mud Lake Flooding
https://www.releases.gov.nl.ca/releases/2017/ma/1002n06.aspx
February 15, 2018 – Water Level Monitoring Enhanced on the Churchill River
https://www.releases.gov.nl.ca/releases/2018/mae/0215n06.aspx
June 11, 2018 – Contract Awarded for Flood Risk Mapping Study of Lower Churchill River
https://www.releases.gov.nl.ca/releases/2018/mae/0611n04.aspx
Contact Us
Maria Murphy
Environmental Scientist
Department of Municipal Affairs and Environment
Tel: 709 896-7981
Email: mariamurphy@gov.nl.ca
Brenda Congram
Environmental Scientist
Department of Municipal Affairs and Environment
Tel: 709 896-5542
Email: BrendaCongram@gov.nl.ca
Adobe® Acrobat® Reader software can be used for viewing PDF documents. Download Acrobat® Reader for free.