
Budget Consultations Survey 2015 was administered between February 17 and March 3, 2015 to seek the views of the people of this province regarding the current fiscal situation.
The survey was carried out by the Newfoundland and Labrador Statistics Agency (NLSA) of the Economics and Statistics Branch of the Department of Finance under the authority of the Newfoundland and Labrador Statistics Agency Act which provides the legal authority to collect the data and guarantees privacy regarding individual responses.
A random, probability based sample of 404 respondents was used and the results are accurate within ±4.9%, 19 times out of 20 (95% confidence level).
Other products created from the survey results include the Telephone Survey Results at a Glance Infographic and the Survey Results Report (PDF format, opens in new window).
The information found here may vary from the information collected during the presentation polling. The information collected here is the result of a scientific information collection process and is representative of the general population of the province, whereas the polling question figures reflect the opinions of those who attended and chose to participate.
Budget Consultations Survey 2015 – Results*
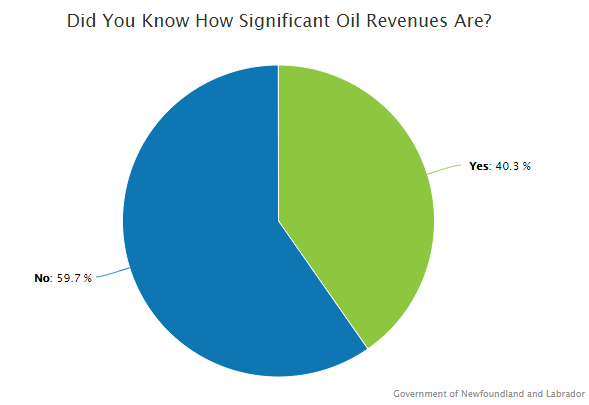
A1. Prior to being contacted to participate in this survey, did you know that such a significant amount (23% – approximately $1.5 billion) of the money the province spends on programs and services comes from oil revenues?
| Response | Percent (%) |
|---|---|
| Yes | 40.3% |
| No | 59.7% |
| Total | 100.0% |
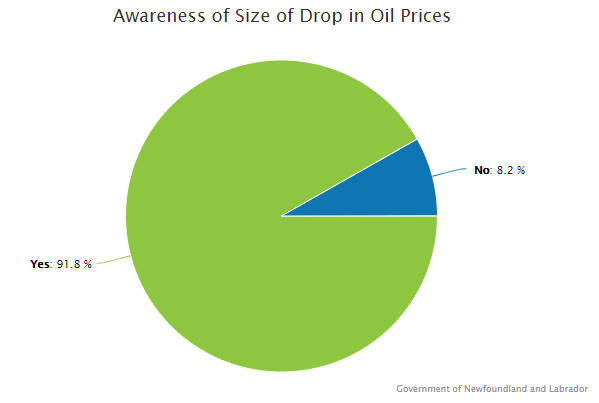
A2. Prior to being contacted to participate in this survey, were you aware that the price of oil had decreased so significantly (nearly 47%) over the past few months?
| Response | Percent (%) |
|---|---|
| Yes | 91.8% |
| No | 8.2% |
| Total | 100.0% |
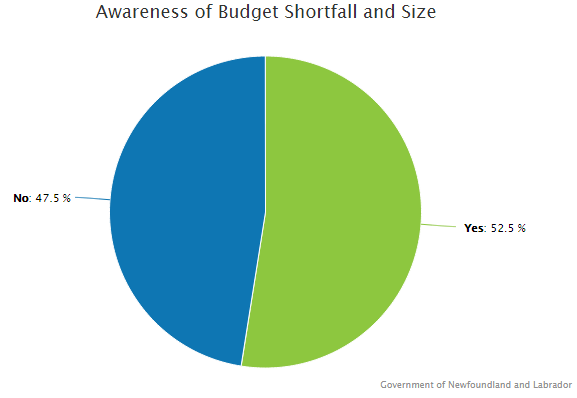
A3. Were you aware that due to this drop in oil prices, the province is anticipating the amount of money it will have to spend on programs and services for next year’s budget will be in excess of $1 billion less?
| Response | Percent (%) |
|---|---|
| Yes | 52.5% |
| No | 47.5% |
| Total | 100.0% |
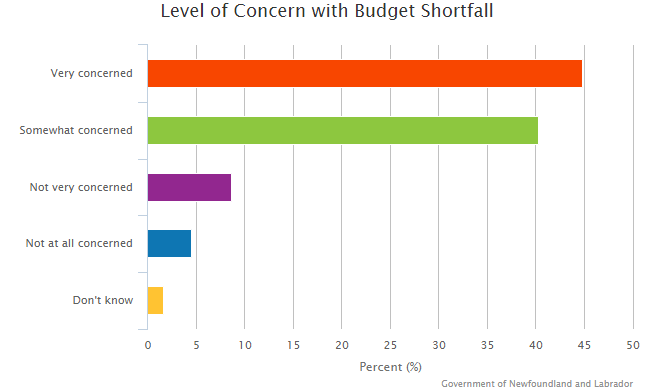
A4. How concerned are you that government will have in excess of $1 billion less to spend on programs and services for next year’s budget?
Respondents were asked to select one response only.
| Response | Percent (%) |
|---|---|
| Very concerned | 44.8% |
| Somewhat concerned | 40.3% |
| Not very concerned | 8.7% |
| Not at all concerned | 4.5% |
| Don’t know | 1.7% |
| Total | 100.0% |
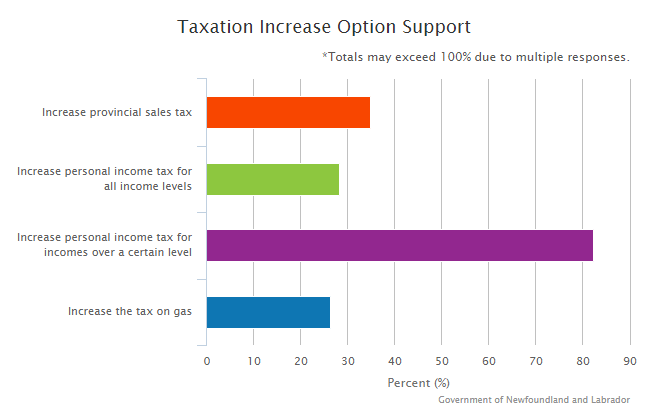
B1. If government were to increase taxes in order to increase revenue to help offset the budget shortfall, in which of the following areas would you support an increase?
Respondents were asked to select all responses they thought would apply.
| Response | Percent (%) |
|---|---|
| Government should not increase taxes | 27.7% |
| Selected one or more of the options listed (See below) | 68.6% |
| Don’t know | 3.7% |
| Response | Percent (%) |
|---|---|
| Increase provincial sales tax | 35.0% |
| Increase personal income tax for all income levels | 28.2% |
| Increase personal income tax for incomes over a certain level | 82.3% |
| Increase the tax on gas | 26.4% |
*Totals may exceed 100% due to multiple responses.
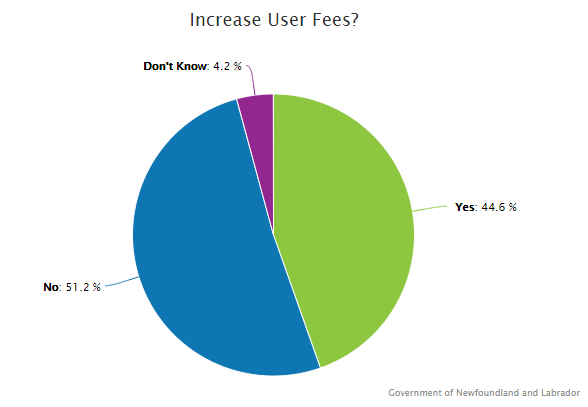
B2. Would you be in favour of government adding new or raising current user fees to increase revenue to help offset the budget shortfall? These would be fees such as registration fees, licencing, etc.
| Response | Percent (%) |
|---|---|
| Yes | 44.6% |
| No | 51.2% |
| Don’t know | 4.2% |
| Total | 100.0% |
B3. Borrowing additional money to help offset the budget shortfall will increase the debt. How comfortable would you be with government borrowing money to offset the budget shortfall?
Respondents were asked to select one response only.
| Response | Percent (%) |
|---|---|
| Very comfortable | 8.4% |
| Somewhat comfortable | 47.0% |
| Not very comfortable | 24.3% |
| Not at all comfortable | 16.6% |
| Don’t know | 3.7% |
| Total | 100.0% |
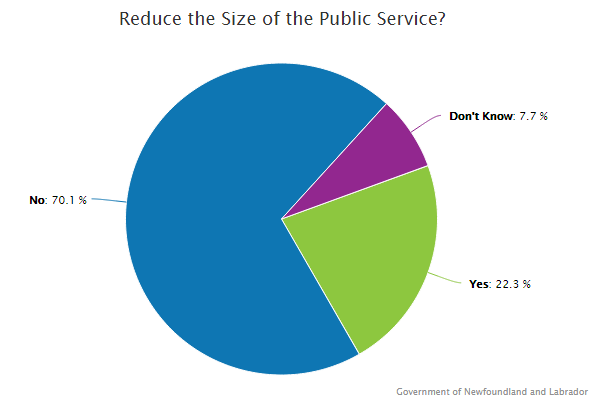
B4. Knowing that reducing the size of the public service could negatively impact the delivery of programs and services, would you be in favour of this?
| Response | Percent (%) |
|---|---|
| Yes | 22.3% |
| No | 70.0% |
| Don’t know | 7.7% |
| Total | 100.0% |
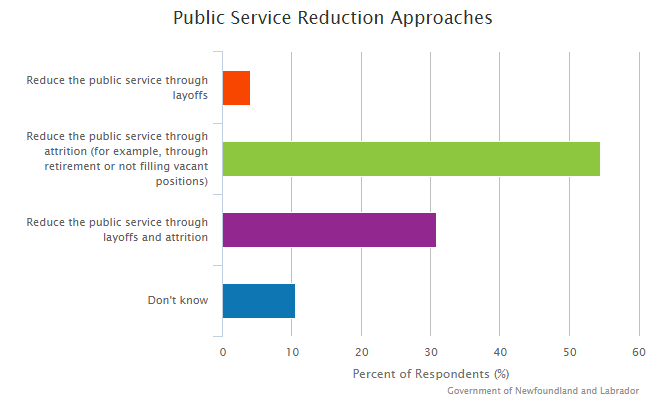
B5. If government were to reduce the size of the public service to help deal with the budget shortfall, which approach do you feel would be the best option?
Respondents were asked to select one response only.
| Response | Percent (%) |
|---|---|
| Reduce the public service through layoffs | 4.0% |
| Reduce the public service through attrition (for example, through retirement or not filling vacant positions) | 54.5% |
| Reduce the public service through layoffs and attrition | 30.9% |
| Don’t know | 10.6% |
| Total | 100.0% |
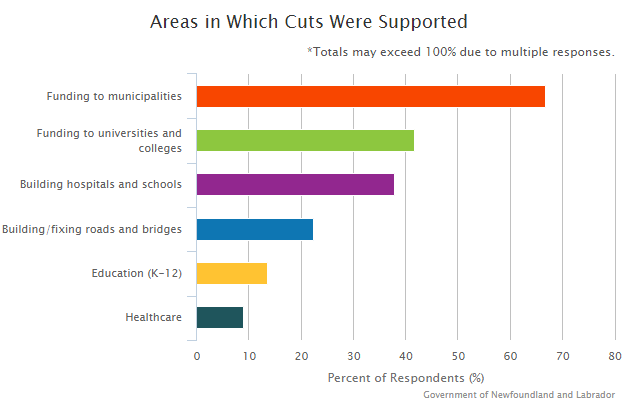
B6. If government were to cut spending to help offset the budget shortfall, in which of the following areas would you support a cut?
Respondents were asked to select all responses they thought would apply.
| Response | Percent (%) |
|---|---|
| Everything should be considered | 35.4% |
| Government should not cut programs and services | 24.8% |
| Selected one or more of the options listed (See below) | 38.6% |
| Don’t know | 1.2% |
Of those who selected one or more options for exploring cuts:
| Response | Percent (%) |
|---|---|
| Funding to municipalities | 66.7% |
| Funding to universities and colleges | 41.7% |
| Building hospitals and schools | 37.8% |
| Building/fixing roads and bridges | 22.4% |
| Education (K-12) | 13.5% |
| Healthcare | 9.0% |
*Totals may exceed 100% due to multiple responses.
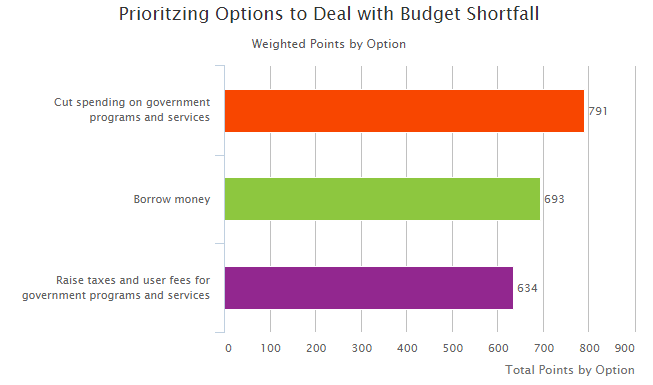
C1. Given that government has these three methods to deal with the current budget shortfall, in which area do you feel government should give the most priority, next priority, least priority?
For this question, a method was used to allocate points based on which of the three options were selected first, second and third:
| First | 3 points |
| Second | 2 points |
| Third | 1 point |
Outcome of survey:
| Rank | Option |
|---|---|
| 1 | Cut spending on government programs and services |
| 2 | Borrow money |
| 3 | Raise taxes and user fees for government programs and services |