
Updated: June 2026
Projections – Main | About the Data | Download Projections | Definitions | Assumptions | Projection Simulator | Demographic Overview | Demographic Reports |
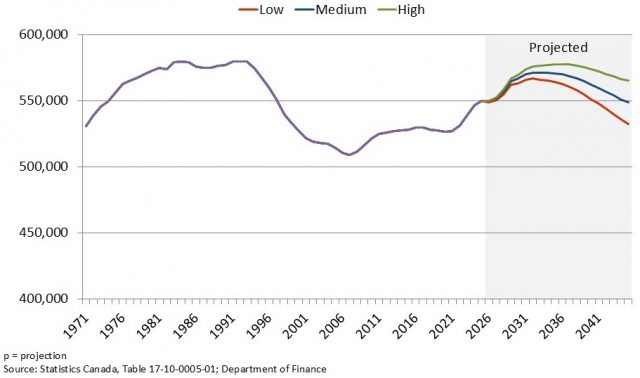
The population of Newfoundland and Labrador peaked in the early 1990s at just over 580,000. However, years of net out-migration and declining fertility rates, combined with the moratoriums in the groundfish fishery, caused the population to decline between 1993 and 2008.
In 2008, the population rose for the first time in 15 years. This growth continued for nine years from 2008 to 2016 as major project activity spurred in-migration to the province. In-migration began to slow in 2013 and net migration became negative again in 2018 as economic activity declined due to major project timelines and low commodity prices. However, net migration became positive again in 2019 and, in 2024, because of record high net in-migration, the province had its largest population increase since 1976. Population increased for the fifth consecutive year in 2025, following a small decline in 2020, and stood at 549,911 as of July 1, 2025.
Natural population change, however, has been negative (more deaths than births) since 2012 and this is expected to continue for the foreseeable future and constrain population growth.
Demographic trends will alter the expectations, demand and needs of the province’s population. The impacts will affect a broad spectrum of this province’s society.
TOPICS
- Fertility and Births
- Mortality
- Natural Population Change
- Migration
- Population
- Aging
- Regional Demographic Change
Fertility and Births
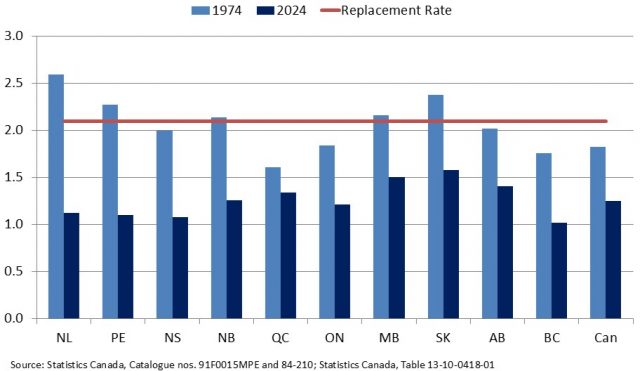
Newfoundland and Labrador’s total fertility rate was 1.12 children per woman of child-bearing age in 2024 (latest year available). This was slightly higher than the recent value of 1.09 recorded in 2023 but well below the 2.1 replacement rate required long term to maintain current population levels in the absence of migration. Among the provinces, the total fertility rate ranged from a low of 1.02 in British Columbia to a high of 1.58 in Saskatchewan in 2024. The overall total fertility rate for Canada in 2024 was 1.25.
The origins of the province’s current demographic situation began with the high fertility rates and increase in births that occurred in most of the industrialized world during the 20-year period that followed World War II. This baby boom period ended midway through the 1960s as female baby boomers began pursuing higher education and entering the workforce at higher rates. This, combined with the introduction and proliferation of birth control methods, pushed fertility rates and the total number of births down in most of the industrialized world, including Canada. Canadian fertility rates have now been below the replacement rate for nearly 50 years.
Fertility rates in this province continued to decline into the 1990s, a period of widespread economic decline in Newfoundland and Labrador. Some improvements occurred after 2000, and the rate rose to 1.55 by 2009. This was short-lived and the rate has since declined and was 1.12 in 2024.
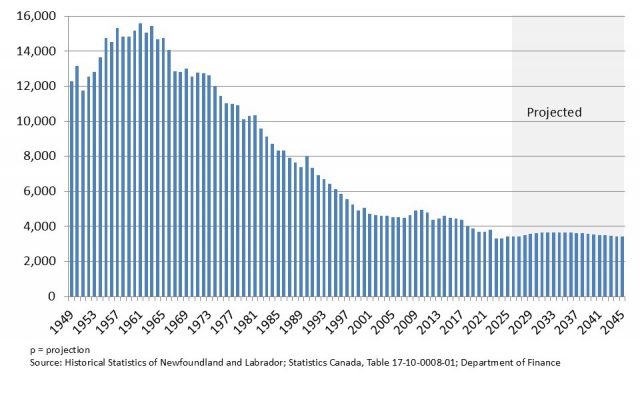
The number of births has declined since the baby boom ended in the mid-1960s. Births dropped from over 15,000 in the mid-sixties to 3,418 in 2025. This trend is the result of a complex set of economic, social and cultural factors that are not easily changed by policy interventions.
Mortality
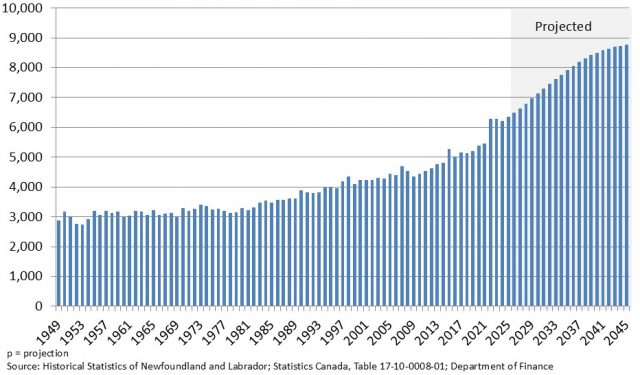
In tandem with increasing life expectancy, age-specific mortality rates have generally declined in the province over the past 50 years. As a result, people are living longer on average, similar to the trend in the rest of Canada and other industrialized areas of the world. However, due to an aging population the number of deaths has increased from about 3,200 in 1971 to more than 6,300 in 2025.
The average life expectancy in the province has increased from roughly 72 years in the early 1970s to around 79 years over the 2023-2025 period. A number of factors have contributed to gains in the province’s life expectancy including improved health care services, better nutritional awareness and practices, and higher average incomes.
Although life expectancy has declined slightly since 2020, it is expected to rise in line with historical trends in the coming years. However, as more people advance into the older age groups, the number of deaths is projected to grow to over 8,700 by 2045.
Natural Population Change
Natural population change (births less deaths) is one of the key components of population change.

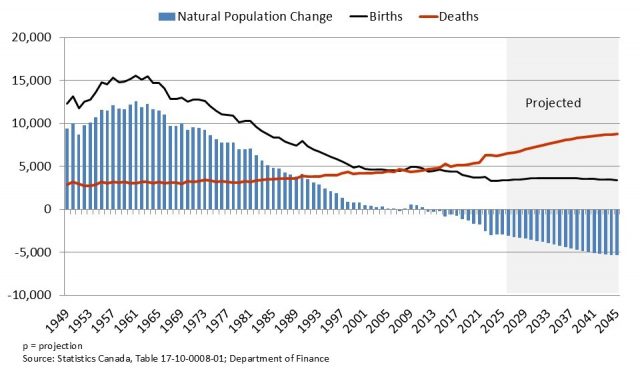
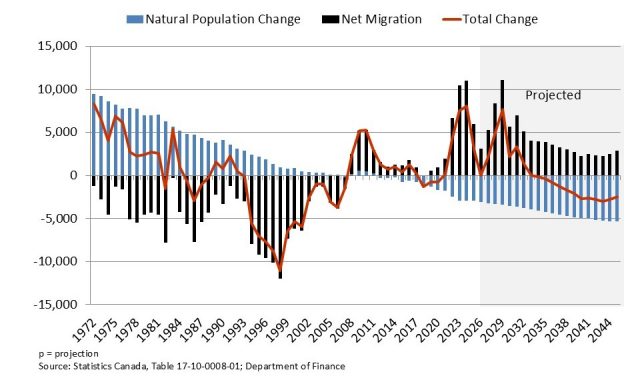
Historically, the high rate of positive natural population change in this province provided a cushion against net out-migration. This situation has changed quite significantly in the past 20 years with the province now recording large natural population declines as a result of increasingly fewer births and aging-related increases in deaths. In 2007 and every year since 2012, Newfoundland and Labrador recorded more deaths than births. This pattern, while more pronounced in Newfoundland and Labrador, is occurring throughout Atlantic Canada. In 2025, all the Atlantic Provinces recorded negative natural population change. Deaths are expected to continue to exceed births in Newfoundland and Labrador in the future and this negative natural population change is expected to become progressively larger over the projection period (present to 2045). In 2025, there were about 2,900 more deaths than births in the province; by 2045, deaths are projected to exceed births by about 5,300.
Migration
Net migration (in-migrants less out-migrants) is the other component of population change. Net migration has historically been negative as the number of people leaving the province has generally been larger than the number of people moving to the province. Between 1972 and 1993, annual net out-migration averaged about 3,800, as residents, primarily younger people, left their home communities (particularly in rural areas) to further their education and/or to seek employment.
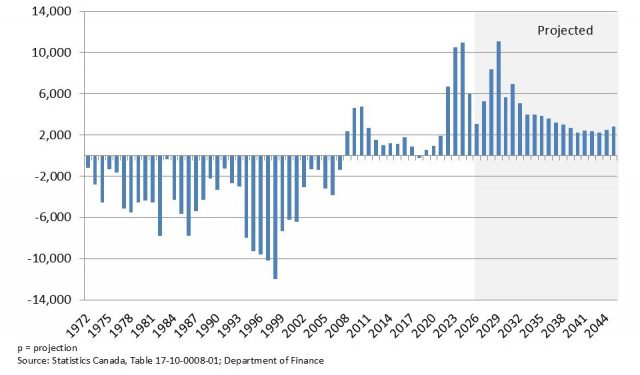
Net out-migration increased rapidly after 1994, following the collapse of the cod fishery, government restraint measures, and Employment Insurance (EI) reform, peaking at about 12,000 in 1998. Net out-migration trended downward for the next several years as adjustments related to these unique economic shocks were absorbed and a period of strong economic growth emerged. Between 2008 and 2017, strong labour demand from major projects led to sustained net in-migration, averaging about 2,200 annually. Net migration turned negative in 2018 before becoming positive again and reached a record high of 10,987 in 2024 before dropping to 5,971 in 2025. Going forward, net migration is expected to remain positive as labour shortages due to population aging are expected to attract more in-migration.
Population
Historically, the impacts of out-migration on population have been offset by a high level of natural population growth. In the 1990s, however, the continual decline in births, together with severe economic shocks, took its toll. A sharp increase in out-migration combined with low natural population growth resulted in a significant population decline.
The onset of oil production in 1997 marked a period of improvement in economic conditions in Newfoundland and Labrador. After years of strong economic growth and high demand for labour for major projects, the province experienced net in-migration and population growth from 2008 to 2017. Population decline occurred from 2018 to 2020, reflecting natural decline and a return of net out-migration due to a slowing economy and employment losses. However, due to record high net migration, the population increased by 8,080 in 2024, the largest increase since 1976. Net migration decreased in 2025, and the population increased by 3,042.
Population is anticipated to decline slightly in 2026 before increasing from 2027 to 2033 as net migration is expected to offset the natural population decline. After reaching a peak of 571,600 in 2033, population is forecast to decline to around 548,800 in 2045 as natural population declines are expected to more than offset net migration gains.
Aging
All Canadian provinces have an aging population and are faced with the challenges this presents for the delivery and financing of social services. In Newfoundland and Labrador, in addition to low fertility rates, high rates of out-migration among young people in the most fertile child-bearing age range have further exacerbated the aging phenomenon. As a result, over the last 50 years the province’s population has aged much more rapidly than in any other province in the country. The province’s median age has gone from five years lower than Canada’s in 1971 to more than seven years higher than Canada’s in 2025. The aging trend will likely continue for years to come, but the rate will slow as more young migrants move to the province.
The median age in the province is expected to increase from 47.8 years in 2025 to 49.3 years in 2045. The size of the senior population in the province is expected to increase substantially between 2025 and 2045, with the 65 plus population increasing by 20.5% and the 75 plus population increasing by around 61%. Aging of the population is an important demographic challenge confronting the province because of its significant implications for government service delivery.
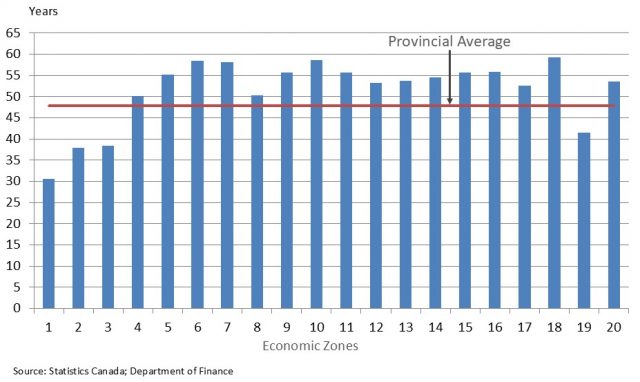
The impacts of aging will vary across regions and are expected to be more pronounced in rural areas of the province as high rates of youth out-migration have significantly reduced the size of cohorts under 50 years of age. For example, in Economic Zone 7 on the province’s Great Northern Peninsula, the median age is currently 58 years (ten years higher than for the province as a whole) and is expected to increase to 62 years by 2045.
|
1991 to 2008 Change
|
2008 to 2025 Change |
2025 to 2045p Change
|
Median Age 2025
|
||||
|---|---|---|---|---|---|---|---|
|
Economic Zone
|
Actual
|
%
|
Actual
|
%
|
Actual
|
%
|
|
|
1
|
200 | 6.6% | 318 | 9.8% | 934 | 26.2% | 30.6 |
|
2
|
-2,354 | -18.9% | 698 | 6.9% | 286 | 2.7% | 37.9 |
|
3
|
-1,009 | -9.8% | 1,166 | 12.6% | 1,738 | 16.7% | 38.4 |
|
4
|
-565 | -18.8% | -623 | -25.6% | -642 | -35.4% | 50.1 |
|
5
|
-475 | -21.4% | -35 | -2.0% | -319 | -18.7% | 55.2 |
|
6
|
-4,398 | -33.4% | -1,687 | -19.3% | -2,734 | -38.7% | 58.4 |
|
7
|
-3,478 | -28.5% | -1,086 | -12.5% | -2,738 | -35.9% | 58.2 |
|
8
|
-5,406 | -11.6% | 1,619 | 3.9% | -2,270 | -5.3% | 50.2 |
|
9
|
-6,439 | -23.0% | -1,334 | -6.2% | -4,940 | -24.5% | 55.7 |
|
10
|
-3,901 | -30.7% | -1,641 | -18.6% | -2,758 | -38.5% | 58.6 |
|
11
|
-6,053 | -30.1% | -1,206 | -8.6% | -3,256 | -25.3% | 55.7 |
|
12
|
-4,867 | -15.6% | 119 | 0.5% | -3,264 | -12.3% | 53.2 |
|
13
|
-2,701 | -26.4% | -1,080 | -14.4% | -2,070 | -32.2% | 53.7 |
|
14
|
-11,088 | -19.1% | -574 | -1.2% | -7,627 | -16.4% | 54.6 |
|
15
|
-7,606 | -21.5% | -809 | -2.9% | -5,325 | -19.7% | 55.6 |
|
16
|
-7,947 | -27.3% | -2,323 | -11.0% | -5,607 | -29.8% | 55.7 |
|
17
|
-5,836 | -12.7% | 1,537 | 3.8% | -4,232 | -10.2% | 52.5 |
|
18
|
-3,091 | -29.1% | -558 | -7.4% | -2,601 | -37.3% | 59.2 |
|
19
|
11,866 | 6.4% | 45,462 | 23.2% | 48,025 | 19.9% | 41.5 |
|
20
|
-2,916 | -26.3% | 381 | 4.7% | -1,746 | -20.4% | 53.6 |
|
Total Province
|
-68,075 | -11.7% | 38,342 | 7.5% | -1,138 | -0.2% | 47.8 |
|
p = projection
|
|||||||
|
Source: Statistics Canada; Department of Finance
|
|||||||
Regional Demographic Change
Population declined in most regions of the province between 1991 and 2008, but the pattern of decline differed, with fishery/EI-dependent rural regions disproportionately impacted. Except for Zone 1 in Labrador and Zone 19 on the Avalon Peninsula, all areas experienced population losses over the 1991 to 2008 period. Areas more heavily dependent on the groundfish fishery, such as the Northern Peninsula, the Northeast Coast, the South Coast and areas of the Avalon Peninsula outside the St. John’s Census Metropolitan Area, experienced the largest population losses.
Larger population losses in rural areas of the province have resulted in an increased concentration of the population in urban areas. Further shifts in the regional distribution of the province’s population are expected as rapid aging in rural areas and in-migration to urban areas continue. This effect, combined with negative natural population change, means that the share of total population in rural areas will continue to trend downward. The total population of the province is expected to decrease by 0.2% by 2045; most regions of the province will continue to record significant population decline while a few others will experience population growth. In particular, the population in Economic Zone 19, which includes most of the St. John’s Census Metropolitan Area, is projected to increase by 19.9% over the 2025 to 2045 period.
The impacts of demographic change, while not all negative, will be felt across a broad spectrum of Newfoundland and Labrador society. It will create challenges in some areas and opportunities for others.
Some areas likely to be impacted include:
- Business sector (e.g., shifting spending patterns and needs)
- Health Care (e.g., home support services, long term care, pharmaceuticals)
- Education (e.g., low enrolment levels, life-long learning)
- Municipalities (e.g., declining revenue base in some communities)
- Social Assistance (e.g., shifting needs)
- Regional Economic Development (e.g., declining rural population)
- Workplace Injury (e.g., higher rehabilitation costs for older workers)
- General Public Sector (e.g., revenue generation, expenditure pressures)
- Labour Markets (e.g., demand, supply imbalances)