
- Building on our Progress
- Our fiscal situation
- A focus on spending
- Government Services
- Government’s biggest areas of expenditure
- Taxpayer impact
- Having your say
Building on our progress
Developing the provincial budget is a process that requires all departments, agencies, boards and commissions as well as government’s business entities to provide input and work together. It sets out spending for the upcoming fiscal year, expected revenues and provides an update on the provincial economy.
As part of the budget process, the Department of Finance engages with people and organizations throughout Newfoundland and Labrador to help identify government spending priorities, and how to strike a balance between the province’s financial situation and the need to deliver programs and services.
Our fiscal situation
Government has been transparent about the challenging fiscal situation facing the province.
In 2016, government released The Way Forward: A vision for sustainability and growth. As government’s key fiscal, economic and social policy document, The Way Forward is a roadmap to a stronger and more diversified economy and a better life, with more opportunities and improved outcomes, for all Newfoundlanders and Labradorians.
Following on this commitment to ensure a prosperous future for everyone who makes their home in Newfoundland and Labrador, government released the second phase of The Way Forward in 2017. Realizing Our Potential set a number of fiscal, social and economic targets that government is well on its way to realizing. government has undertaken various actions aimed at laying a stronger economic foundation, ensuring better outcomes, providing better services and creating a more efficient public sector.
With the commitment for improved delivery of services by a more efficient public sector, government is asking Newfoundlanders and Labradorians, through the 2018 pre-budget consultation process, a series of questions related to how and where we spend their tax dollars.
Through The Way Forward and the work done in Budget 2017 – both of which were informed by the people, businesses and organizations in this province – we are taking measures to returning to fiscal stability. In the recent mid-year fiscal update, government’s revenue forecast remained 99 per cent on target despite challenging economic conditions and volatile oil prices. Despite this, our fiscal situation remains unstable and current spending is not sustainable.
We will continue to take a balanced approach to managing the province’s fiscal resources and delivering in a more efficient way the programs and services that are important to Newfoundlanders and Labradorians.
A focus on spending
Government has a significant spending problem that must be addressed
Revenue and Expenses
| Budget (April 2017) |
Update (November 2017) |
Variance | |
|---|---|---|---|
| Revenue | 7,338.9 | 7,260.1 | (78.8) |
| Expenses | 8,116.5 | 8,112.5 | (4.0) |
| Deficit ($M) | (777.6) | (852.4) | (74.8) |
Spending has for many years outpaced revenues, with the province’s net debt now at a record level of $13.6 billion. Without the action taken by government in 2016 and 2017, this net debt number would have been much higher.
This year, pre-budget consultations will focus on spending. Rather than making major cuts to these services, government is seeking input into ways to find efficiencies in service delivery. Stakeholders and members of the public are asked to offer their ideas and insights on how government can reduce spending while remaining on track in its efforts to return the province to a place of financial stability.
There are no easy solutions to address spending. The majority of government’s spending goes towards services that are important for the people of Newfoundland and Labrador. Any approach to spending reduction must be mindful of this reality. While spending cuts would lead to a reduction in services, efforts to find efficiencies and creative solutions allow government to continue delivering these services.
Government Services
Government services are delivered both from core government departments and through government’s agencies, boards and commissions.
Some of these services include:
| Core Government | Agencies, Boards and Commissions |
|---|---|
| Motor Registration Division (Service NL) | Healthcare services (Regional Health Authorities) |
| Roads (Transportation and Works) | Education – Post-Secondary (Memorial University and College of North Atlantic) |
| Ferries (Transportation and Works) | Education – K-12 (English and French School Districts) |
| Fire and Emergency Services (Municipal Affairs and Environment) | Power generation (NL Hydro and Nalcor) |
| Vital Statistics (Service NL) | Public Housing (Newfoundland Labrador Housing Corporation) |
| Medical Care Plan (MCP) (Health and Community Services) | The Rooms |
| Income Support and Employment Programming (Advanced Education, Skills and Labour) | Marble Mountain |
| Provincial Operations and Infrastructure (Transportation and Works) | Newfoundland Liquor Corporation |
| Municipal Operations and Infrastructure (Municipal Affairs) | Legal Aid |
| Child and Youth Services (Children, Seniors and Social Development) | 911 Bureau |
| Prescription Drug Program (Health and Community Services) | |
| Regulations (real estate, securities, lotteries, etc.) (Service NL) | |
| Inspections (school buses, food establishments, etc.) (Service NL) |
In order to reduce spending, we must explore ways to deliver these and other services more efficiently and in a way that achieves better outcomes for the people of the province.
Government’s biggest areas of expenditure
Spending for Core Government versus Agencies, Boards and Commissions
| Budget (April 2017) |
Update (November 2017) |
Variance | |
|---|---|---|---|
| Gross Expenses | |||
| Government Departments | 3,808.9 | 3,786.6 | (22.3) |
| Agencies, Boards and Commissions | 4,307.6 | 4,325.9 | 18.3 |
| Total Expenses ($M) | 8,116.5 | 8,112.5 | (4.0) |
In government departments, recent efforts have resulted in a more efficient public service. At the mid-year update, government departments were spending $22 million less than was forecast in Budget 2017, mostly as a result of finding efficiencies. Departments are exercising a smarter, evidence-based approach to spending, and efforts on this front continue.
At mid-year, agencies, boards and commissions, on the other hand, were tracking $18 million above their forecast from Budget 2017. These boards make up approximately 60 per cent of government’s expenses, and almost 80 per cent of total salaries and benefits. In order for government to reduce its spending, agencies, boards and commissions will need to find cost reductions and operational efficiencies.
When considering spending reductions in Newfoundland and Labrador, it is important to understand where government spends its money, and why certain things cost what they do. Government must take a balanced approach to spending reductions.
Health Care
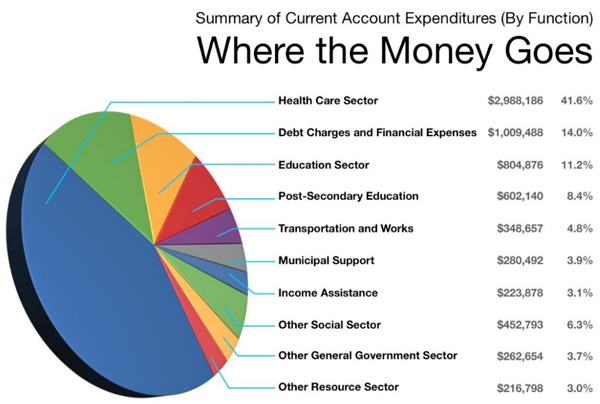
Health care is the Province’s single largest expenditure area, making up 41.6 per cent of cash expenditures in the Budget 2017 estimates.
Source: Canadian Institute for Health Information for 2015; Department of Finance
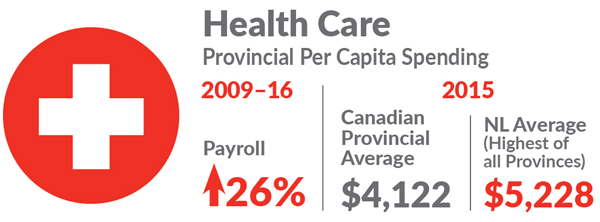
Newfoundland and Labrador leads the country in provincial per capita health care spending. In 2015 (the last year data is available) the per capita spend on health care by this province was $5,228, with Alberta as the next highest at $4,804. This province spends far above the Canadian provincial average of $4,122.
These are realities we face when considering health care services. In order to maintain an acceptable level of service for the people of this province, it will be necessary to find efficiencies across the health care system, as well as new technologies and innovative solutions.
Since 2009-10, the number of employees working in the health care sector in regional health authorities has remained relatively stable, while payroll in the sector has increased significantly.
In 2009-10, there were just over 19,000 employees in the health care sector, with a combined salary of approximately $1.1 billion. In 2016-17, the number of employees had decreased to just under 19,000, while the combined salary of the health care sector had risen to nearly $1.4 billion.
Over this period, the number of paid hours of work remained stable, between 32-34 million hours per year, while payroll expense increased by 26 per cent.
These increases are the result of several factors, including negotiated collective agreements.
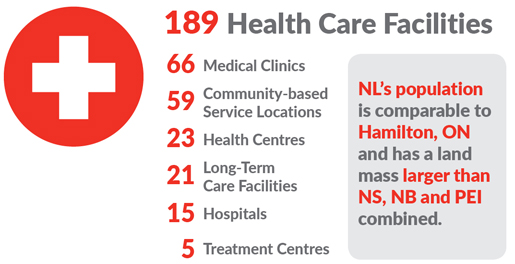
Some of this disparity can be attributed to a dispersed rural population. This province has a population comparable to Hamilton, Ontario, spread out across a landmass that is larger than all three other Atlantic Provinces combined. This makes it more expensive to deliver health care services compared to provinces with a greater population density. Other factors, such as demographics and health status, also have an impact.
There are currently 189 health care facilities in Newfoundland and Labrador, dispersed throughout the province. Most facilities serve a large geographic area, and there are different services offered at each.
Education – K-12
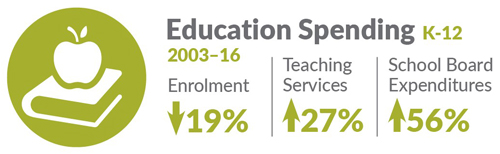
Since 2003, spending on teaching services has increased 27 per cent and spending on school board operations has increased 56 per cent. It is important to note that these increases are also related to changes in school staffing and operational structures. This occurred at a time when the number of teachers in the province has decreased by approximately 11 per cent. At the same time, student enrollment has decreased by just under 19 per cent.
The lack of population density is one reason for these expense increases, as there are numerous schools in the province with low enrolment. However, some of these schools serve a large geographic area. Other reasons include changes in benefits agreed upon through collective bargaining, negotiated salary increases and factors such as length of time in positions and increased qualification levels.
In order to reduce spending and find efficiencies, it will be important to find a balance between these pressures.
Education – Post-Secondary
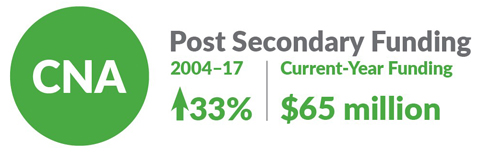
Provincial Government support for College of the North Atlantic’s operations increased approximately 33 per cent between 2004-05 and 2017-18.
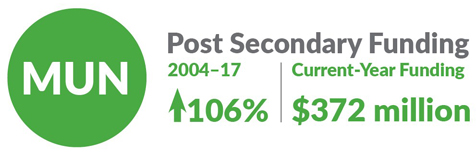
Provincial Government support for Memorial University’s operations increased by approximately 106 per cent between 2004-05 and 2017-18. The Provincial Government subsidizes almost 80 per cent of MUN’s operating costs.
It will be important to consider how the university uses its operating grant, within the context of the province’s fiscal realities.
Provincial Ferries
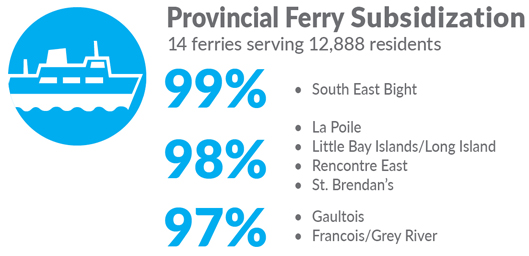
Subsidization is calculated based on 2016-2017 Operating Cost. Operating costs Include: vessel operations (crew, fuel, supplies), vessel refits, vessel insurance, emergency air service. Wharf and terminal upgrades, vessel acquisitions, and administration costs are not included.
The Provincial Government currently subsidizes all ferry routes in the province. Some routes, such as the Labrador Straits, the North Coast of Labrador, Ramea and Fogo Island contribute more revenues towards their own operations than others.
However, nine of the provincial ferry routes receive subsidies from government that represent more than 95 per cent of their operating budget. Eight of these ferries service an area with a population below 250 people.
Ferries such as Bell Island, Fogo/Change Islands, the Labrador Straits and Little Bay Islands/Long Island have higher annual ridership. However, there were nine provincial ferry routes with less than 20,000 passengers last year, six of which had less than 9,000. Of these, only Ramea and St. Brendan’s carried vehicles, and each carried fewer than 9,000 vehicles in 2016-17.
The average use of most ferries in the province is well below 50 per cent of the capacity of those vessels.
A Balanced Approach
While many of these program areas have seen significant growth since the early 2000s, these services are important to the people they serve. While considering cost reductions, it is important to keep in mind the potential impact of spending reductions on service delivery.
Taxpayer impact
As we look at ways to reduce government spending, it is important to also examine what impacts current levels of spending have on taxpayers in Newfoundland and Labrador. Consider the following:
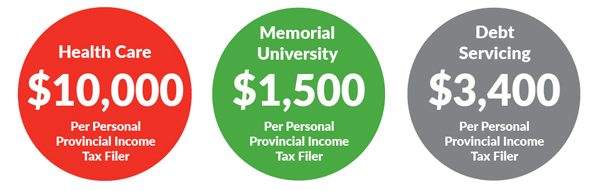
Note: These figures are approximate and for discussion purposes only. For this illustration, the term taxpayer was limited to Provincial Income Tax Filers that paid any amount of Provincial Income Tax in 2015. Total Provincial Taxpayers for 2015 was 283,966 persons.
These are just a few examples of how Government spending on services has a direct impact on the taxes you pay. As we explore ways to reduce spending, and when evaluating the services government delivers, we must keep this key fact in mind.
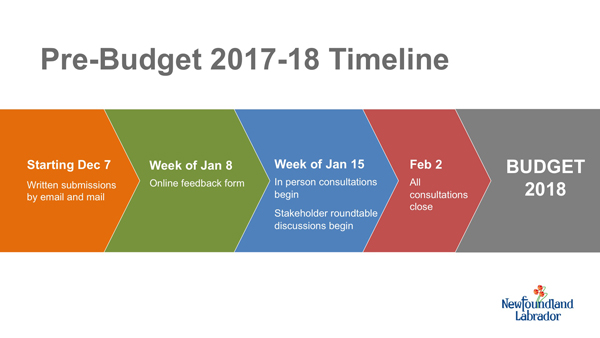
Having your say
In light of the fiscal realities of Newfoundland and Labrador, we want your ideas on how we can address these spending issues.
There are numerous ways to make your voice heard as part of the pre-budget process. You can click the link below to fill out our questionnaire. Feedback will be accepted until February 2, 2018. To protect your privacy, please do not include your name or information that could identify you. This information is being collected for the purpose of obtaining your views to help inform the 2018 budget process. The information is collected under the authority of section 61(c) of the Access to Information and Protection of Privacy Act, 2015. If you have any questions or require an alternate format, please contact Budget2018@gov.nl.ca or phone (709) 729-3166.
There will also be in-person consultations in several locations in the province. These are:
| Date and time | Location | Hosting Minister |
|---|---|---|
| Jan 18. 7-9 p.m. | Capital Hotel, 208 Kenmount Road, St. John’s | Minister Osborne |
| Jan. 18, 7-9 p.m. | Albatross Hotel, 114 Trans-Canada Highway, Gander | Minister Haggie |
| Jan. 22, 7-9 p.m. | St. Joseph’s Hall, 5 Station Road, Grand Falls-Windsor | Minister Hawkins |
| Jan.25, 7:30-9:30 p.m. | Corner Brook Civic Centre, 1 Canada Games Place, Corner Brook | Minister Byrne |
| *UPDATED Jan. 29, 7-9 p.m. |
Hotel North Two, 382 Hamilton River Road, Happy Valley Goose-Bay | Minister Dempster |
| Jan. 30, 7-9 p.m. | Bishop Feild Elementary (located in former School for the Deaf), 425 Topsail Road, St. John’s | Minister Osborne |
You can also provide feedback via:
Email: Budget2018@gov.nl.ca
Mail:
Minister of Finance
c/o Pre-Budget 2018
Department of Finance
P.O. Box 8700
Main Floor, East Block Confederation Building
St. John’s, NL A1B 4J6