
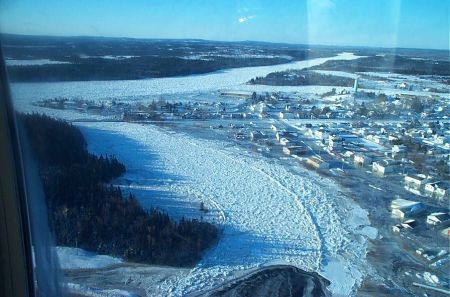
Flooding has occurred on several occasions at Badger since the early 1900’s. The floods are caused by excessive frazil ice formation in the Exploits River due to high winds and low temperatures when the ice front is at or is passing Badger. This causes an ice jam in the river and in turn causes the river to spill its banks resulting in a flood. The ice cover forms near Grand Falls and travels upstream to Red Indian Lake.
The Badger Flood Forecasting Service is initiated in December of each year and extends until the end of March or until it is confirmed the ice cover no longer poses a threat of flooding to the Town.
- Quick View of Exploits River Near Real Time Data
As part of the data collection network that is critical for the operation of the Ice Progression Model, the Division maintains and monitors five hydrometric gauging stations on the Exploits River. A primary and backup station are located in the Town of Badger, the primary station is directly accessible by the Town for use in daily monitoring and emergency situations. Additionally, the Division maintains and monitors a webcam and a weather station located in the Town and a second webcam located at Badger Steps, a critical and inaccessible section of the Exploits River. - RADAR Images for Badger
Due to the volume and frequent updating of the water level and other data made available on this web site this data is considered to be PROVISIONAL because it has not undergone quality control checks. These data may be subject to significant change.
The Town of Badger is located in the central region of the province of Newfoundland and Labrador, west of Grand Falls-Windsor. Badger is situated at the confluence of three rivers, the largest of which is the Exploits River.
Flood Risk Mapping
Badger has a long recorded history of flooding dating back to 1916. Following the flood in 1983, a hydrotechnical study was carried out under the Canada-Newfoundland Flood Damage Reduction Program. The study analyzed causes of the previous floods, looked at remedial measures and produced a flood risk map for the town.
The flood risk map shows the flood risk zones for floods with a return period of 20 years (5% chance in any year) and 100 years (1% chance in any year). This map is used for public information, municipal planning, development control, and the setting of structural design criteria. All proposed developments in flood risk zones are evaluated against potential impacts on water resources, on the developments themselves, and on the surrounding areas.
The flood risk map for Badger is available in electronic format through the links below or can be obtained from the Department of Environment as a 60x90cm folded paper map. Please contact us if you wish to obtain a paper copy.
Flood Information Map for Badger
Small JPG Large JPG Adobe PDF (1.1 MB)
Flood of 2003
The flood that occurred in 2003 was the most severe in terms of the depth of inundation, the speed at which the flooding occurred and the damages to the town. On the morning of February 15, in less than an hour, the water level rose 2.3 metres. In the days that followed, extremely cold conditions froze the flood waters and encased a large portion of the town in ice for weeks. A report entitled “Badger Flood 2003 Situation Report” was prepared after this event and it gives detailed information about the hydrology of the flood. A subsequent flood event occurred in February 2013. A Field Report is also available for that event: Badger Flood Event 2013 – Field Report.
The Water Resources Management Division has carried out river flow monitoring and flood forecasting for Badger since the 1977 flood. A computer simulation model called the “Ice Progression Model” currently used by the Division for flood forecasting was developed to simulate ice conditions on the Exploits River. This model was developed as part of the study “Hydrotechnical Study of the Badger and Rushy Pond Areas (Fenco Newfoundland, 1985) ” and further refined in the study “River Ice Modelling Study Exploits River at Badger (Fenco MacLaren, 1995).
River Monitoring and Flood Forecasting
From December 2003 to March 2008, the WRMD obtained satellite RADAR imagery from the ENVISAT and RADARSAT polar orbiting satellites. This RADAR imagery service was provided by C-CORE under the Polar View initiative of the European Space Agency’s Global Monitoring for Environment and Security (GMES ) program. These RADAR Images were used in an operational sense to determine the location of the ice front. The utility of RADAR imagery for ice observation provided several important advantages over volunteer observations and / or optical imagery. RADAR offers: a “big picture” view, all weather operation (sees through rain, snow and fog), and twice daily observations if needed. Before December 2003, ice observations were limited for the most part to volunteer observations made by Town officials and paper mill staff.
Since December 2008, the Water Resources Management Division has also been able to access RADAR imagery from RADARSAT-2, the world’s most advanced commercial C-Band synthetic aperture radar satellite. This has been made possible through a partnership with the Government of Canada. As part of its responsibilities under the Emergency Management Act, Public Safety Canada coordinates the Government of Canada’s emergency management activities with the provinces and territories, and provides support to provincial and territorial emergency management activities. Through a Memorandum of Understanding with the Canadian Space Agency, Public Safety Canada has established protocols that are successfully enabling the Water Resources Management Division to work in concert with the Government Operations Centre to use RADARSAT-2 data for river ice monitoring. The continuing success of this new partnership will provide the Water Resources Management Division with world class data to meet its emergency management needs.
These observations formed the basis of model calibration. Model calibration was quite often difficult since there were only a few vantage points on the riverbank where ice observations could be made. Ice observation was enhanced in a major way by RADAR imagery. The accurate location of the ice front reduces the uncertainty associated with the timing of the flood. The use of RADAR imagery for accurate location of the ice front represents a major improvement in the flood forecast capability for the residents of Badger. The RADAR images have proved themselves to be absolutely essential to the successful ice progression modelling and calibration effort.
Data from these stations is shown below and is updated automatically throughout the flood forecasting season. Due to the volume and frequent updating of the water level and other data made available on this web site this data is considered to be PROVISIONAL because it has not undergone quality control checks. These data may be subject to significant change.
Exploits River Stations
| Station Name | Location | ADRS | EC |
|---|---|---|---|
| Red Indian Lake at Indian Point | 52 km – Upstream of Badger | 02YO017 | EC |
| Exploits River Near Millertown | 50 km – Upstream of Badger | 02YO016 | EC |
| Exploits River Below Noel Pauls Brook | 25 km – Upstream of Badger | 02YO011 | EC |
| Exploits River at Badger | 0 km – Badger | 02YO013B | |
| Exploits River at Badger East of Stadium |
0 km – Badger | NLENCL0002 | |
| Badger Steps |
7 km – Downstream of Badger | NLENCM0001 | |
| Exploits River at Charlie Edwards Point | 20 km – Downstream of Badger | 02YO018 | EC |
| Exploits River at Bishop’s Falls Trestle |
Bishop’s Falls | NLENHM0003 |
| Definitions | Description |
|---|---|
| A Webcam is installed at this site. | |
| ADRS | This link displays the web page for this station which includes graphs of all data and downloadable csv files. Due to the volume and frequent updating of the data the streamflow, water quality and climate data shown is PROVISIONAL and has not undergone quality control checks. These data may be subject to significant change. |
| EC | This link is to the Environment Canada, Water Survey of Canada web page for this station. Provisional Stage-Flow data and Stage-Flow data that has gone through a comprehensive QA/QC procedure are available. There are also links to historical publication quality Stage-Flow data and summaries for each station. |
Adobe® Acrobat® Reader software can be used for viewing PDF documents. Download Acrobat® Reader for free.