
Moose Population Management
Links to select area maps below now also contain mapping for moose population density estimations. There is also now a second link to tables with information and data used to calculate area population densities. More information on the process of collection and calculation, as well as uses for the information are available here.
To reference a full map of all Moose Management Areas in Newfoundland and Labrador, see here.
| Moose Management Areas (Newfoundland) | Season dates 2026-27 | Resident | Non-Resident Quota |
Total Quota | Quota Changes | Overall Success Rate 2024 (%) |
|
| Either Sex | Male | ||||||
| 1 St. Anthony | Sept. 12 – Dec. 31 | 331 | 182 | 37 | 550 | 0 | 58.08 |
| Area Map with Moose Density | |||||||
| Population Information | |||||||
| 2 Portland Creek | Sept. 12 – Dec. 31 | 637 | 239 | 74 | 950 | 0 | 65.91 |
| Area Map with Moose Density | |||||||
| Population Information | |||||||
| 2A Cow Head-St. Paul’s | Sept. 12 – Dec. 31 | 20 | 0 | 0 | 20 | 0 | 41.67 |
| 2B Sally’s Cove | Sept. 12 – Dec. 31 | 10 | 0 | 0 | 10 | 0 | 70.0 |
| 2E GMNP (Zones) | Zone 1: Saturday, Sept 26, 2026 to Sunday, Jan 31, 2027 | 500 | 0 | 0 | 500 | 0 | 42.8 |
| Zone 2: Saturday, Oct 17, 2026 to Sunday, Jan 31, 2027 | |||||||
| Zone 3: Saturday, Nov 14, 2026 to Sunday, Jan 31, 2027 | |||||||
| Zone 4: Closed to hunting | |||||||
| 3 Harbour Deep | Sept. 12 – Dec. 31 | 743 | 0 | 357 | 1100 | 0 | 46.9 |
| Area Map with Moose Density | |||||||
| Population Information | |||||||
| 4 Taylor’s Brook | Sept. 12 – Dec. 31 | 495 | 73 | 157 | 725 | 100 | 81.9 |
| 5 Trout River | Sept. 12 – Dec. 31 | 1006 | 281 | 38 | 1325 | 100 | 63.8 |
| 5A Rocky Harbour | Sept. 12 – Dec. 31 | 30 | 0 | 0 | 30 | 0 | 52.22 |
| 6 Corner Brook | Sept. 12 – Dec. 31 | 1112 | 262 | 76 | 1450 | 0 | 62.46 |
| 7 South Brook | Sept. 12 – Dec. 31 | 484 | 235 | 31 | 750 | 0 | 61.15 |
| Area Map with Moose Density | |||||||
| Population Information | |||||||
| 8 St. Georges | Sept. 12 – Dec. 31 | 596 | 148 | 126 | 870 | 0 | 59.39 |
| Area Map with Moose Density | |||||||
| Population Information | |||||||
| 9 Anguille Mtns. | Sept. 12 – Dec. 31 | 167 | 118 | 195 | 480 | -50 | 59.96 |
| Area Map with Moose Density | |||||||
| Population Information | |||||||
| 10 Port aux Basques | Sept. 12 – Dec. 31 | 275 | 204 | 246 | 725 | -100 | 62.57 |
| Area Map with Moose Density | |||||||
| Population Information | |||||||
| 11 Dashwoods | Sept. 12 – Dec. 31 | 243 | 88 | 329 | 660 | 0 | 67.83 |
| Area Map with Moose Density | |||||||
| Population Information | |||||||
| 12 Buchans | Sept. 12 – Dec. 31 | 155 | 35 | 185 | 375 | 0 | 62.85 |
| Area Map with Moose Density | |||||||
| Population Information | |||||||
| 13 Gaff Topsails | Sept. 12 – Dec. 31 | 138 | 22 | 160 | 320 | 0 | 80.95 |
| Area Map with Moose Density | |||||||
| Population Information | |||||||
| 14 Baie Verte | Sept. 12 – Dec. 31 | 447 | 398 | 55 | 900 | -50 | 62.41 |
| 15 Twin Lakes | Sept. 12 – Dec. 31 | 716 | 367 | 117 | 1200 | 50 | 58.64 |
| 16 Sandy Badger | Sept. 12 – Dec. 31 | 92 | 43 | 65 | 200 | 25 | 71.82 |
| Area Map with Moose Density | |||||||
| Population Information | |||||||
| 17 Millertown | Sept. 12 – Dec. 31 | 234 | 186 | 230 | 650 | 0 | 76.38 |
| Area Map with Moose Density | |||||||
| Population Information | |||||||
| 18 Granite Lake | Sept. 12 – Dec. 31 | 100 | 100 | 150 | 350 | 0 | 69.86 |
| 19 Grey River West | Sept. 12 – Dec. 31 | 227 | 80 | 143 | 450 | 0 | 72.09 |
| 20 Round Pond | Sept. 12 – Dec. 31 | 70 | 30 | 20 | 120 | 0 | 63.80 |
| 21 Rattling Brook | Sept. 12 – Dec. 31 | 141 | 43 | 116 | 300 | 25 | 69.20 |
| Area Map with Moose Density | |||||||
| Population Information | |||||||
| 22 Lewisporte | Sept. 12 – Dec. 31 | 443 | 295 | 112 | 850 | 0 | 69.47 |
| Area Map with Moose Density | |||||||
| Population Information | |||||||
| 23 Bonavista North | Sept. 12 – Dec. 31 | 388 | 288 | 24 | 700 | 0 | 69.48 |
| 24 NorthWest Gander | Sept. 12 – Dec. 31 | 56 | 56 | 48 | 160 | 0 | 75.92 |
| Area Map with Moose Density | |||||||
| Population Information | |||||||
| 25 Bay d’Espoir | Sept. 12 – Dec. 31 | 252 | 181 | 92 | 525 | 0 | 70.92 |
| 26 Jubilee Lake | Sept. 12 – Dec. 31 | 363 | 0 | 87 | 450 | 0 | 53.96 |
| 27 Terra Nova | Sept. 12 – Dec. 31 | 93 | 45 | 62 | 200 | 0 | 67.82 |
| Area Map with Moose Density | |||||||
| Population Information | |||||||
| 28 Black River | Sept. 12 – Dec. 31 | 234 | 84 | 32 | 350 | 50 | 66.73 |
| Area Map with Moose Density | |||||||
| Population Information | |||||||
| 28A TNNP (Zones) | Oct. 13, 2026 – Jan. 31, 2027 | 30 | 0 | 0 | 30 | 5 | 24.00 |
| 29 Bonavista Pen. | Sept. 12 – Dec. 31 | 400 | 300 | 0 | 700 | 0 | 63.36 |
| 30 Burin Pen Knee | Sept. 12 – Dec. 31 | 450 | 275 | 0 | 725 | 50 | 66.86 |
| 31 Placentia | Sept. 12 – Dec. 31 | 430 | 0 | 0 | 430 | 130 | 49.36 |
| Area Map with Moose Density | |||||||
| Population Information | |||||||
| 32 Cape Shore | Sept. 12 – Dec. 31 | 285 | 100 | 0 | 385 | 60 | 54.98 |
| Area Map with Moose Density | |||||||
| Population Information | |||||||
| 33 Salmonier | Sept. 12 – Dec. 31 | 450 | 0 | 0 | 450 | 125 | 42.86 |
| 34 Bay De Verde | Sept. 12 – Dec. 31 | 530 | 0 | 0 | 530 | 80 | 60.90 |
| 35 St John’s | Sept. 12 – Dec. 31 | 475 | 0 | 0 | 475 | 100 | 31.34 |
| Area Map with Moose Density | |||||||
| Population Information | |||||||
| 36 Southern Shore | Sept. 12 – Dec. 31 | 880 | 350 | 0 | 1230 | 180 | 54.13 |
| 37 Grey River East | Sept. 12 – Dec. 31 | 242 | 0 | 108 | 350 | 0 | 52.06 |
| 38 Burin Pen. Foot | Sept. 12 – Dec. 31 | 200 | 150 | 0 | 350 | 0 | 85.86 |
| 39 Cloud River | Sept. 12 – Dec. 31 | 280 | 0 | 70 | 350 | 0 | 44.95 |
| Area Map with Moose Density | |||||||
| Population Information | |||||||
| 39A Cloud River | Sept. 12 – Dec. 31 | 17 | 0 | 83 | 100 | 0 | 81.63 |
| 40 Conche | Sept. 12 – Dec. 31 | 690 | 191 | 119 | 1000 | 0 | 55.76 |
| Area Map with Moose Density | |||||||
| Population Information | |||||||
| 41 Sheffield Lake | Sept. 12 – Dec. 31 | 143 | 95 | 62 | 300 | 0 | 63.55 |
| Area Map with Moose Density | |||||||
| Population Information | |||||||
| 42 Gambo | Sept. 12 – Dec. 31 | 98 | 78 | 44 | 220 | 25 | 92.47 |
| Area Map with Moose Density | |||||||
| Population Information | |||||||
| 43 Port Au Port | * Sept. 12 – Dec. 31 | 125 | 0 | 0 | 125 | 25 | 66.00 |
| 44 Bellevue | Sept. 12 – Dec. 31 | 290 | 0 | 0 | 290 | 140 | 59.42 |
| 45 Ten Mile Lake | Sept. 12 – Dec. 31 | 659 | 161 | 80 | 900 | 0 | 67.66 |
| 47 Random Island | Sept. 12 – Dec. 31 | 20 | 20 | 0 | 40 | 0 | 76.33 |
| 100 Avalon MRZ | Sept. 12 – Dec. 31 | 600 | 0 | 0 | 600 | 0 | 32.36 |
| 101 Central MRZ | Sept. 12 – Dec. 31 | 400 | 0 | 0 | 400 | 0 | 38.72 |
| Charitable/NFP | 480 | 20 | |||||
| Totals | 18492 | 5803 | 3930 | 28705 | 1090 | 61.09 | |
- NFP licences: Foresty, Agriculture and Lands, 370; Gros Morne National Park 90 (+15); Terra Nova National Park 20 (+5).
- Bow hunting begins August 29, 2026 (Note: this does not include cross bows) for areas opening on September 12, 2026
- Non-resident licence quotas are provided to licenced outfitters in various MMAs.
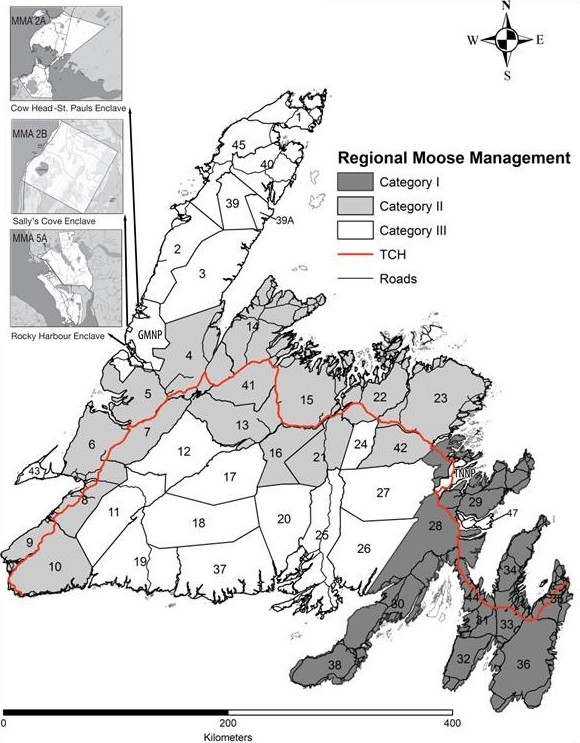
Please note that the 2022-2026 Management Plan includes objectives to maintain preferred target densities of moose throughout the island of Newfoundland (number of moose per square kilometre in an area) that considers MMA’s along the Trans Canada Highway and in the eastern portion of the island where traffic volumes are highest. Category 1 – 1.0 moose per km2, Category 2 – 1.5 moose per km2, and Category 3 – 2.0 moose per km2 These target densities are considered as well when making annual adjustments to individual MMA quotas.
Advisories
Quotas for some Moose Management Areas (MMAs) may change pending aerial census work being carried out during the winter of 2025/26. Changes will be announced through a Departmental News Release prior to the big game licence draw. News releases are available online at https://www.gov.nl.ca/releases/
Over 75 percent of meat spoilage cases that are reported occur as a result of improper handling or field care by the hunter. A replacement licence will only be issued if an animal is found to be unfit for consumption because of disease or previous injury and the entire carcass has been submitted for disposal. Contact your nearest FAL office for more information.
Piebald Moose
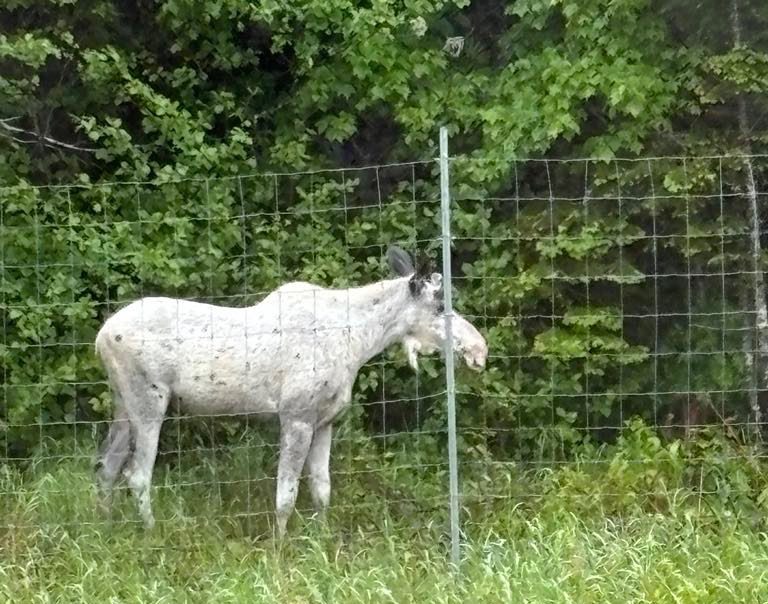
Characterized by patches of white fur or uneven color distribution, piebald is a rare genetic variation and not a distinct subspecies of moose. This unique coloration results from a recessive genetic mutation that affects the animal’s pigment. The recessive gene must be carried by both parents in order for the trait to be expressed in their offspring, though they may not display the trait themselves.
* Hunters are reminded that for MMA 43 there is no open season for the hunting of moose that are predominately white in color.